
Yesterday the market fell into broad support on the S&P 500. While it’s too soon to tell if the final low is in, I do believe the probabilities are good for a solid retracement rally at the very least.
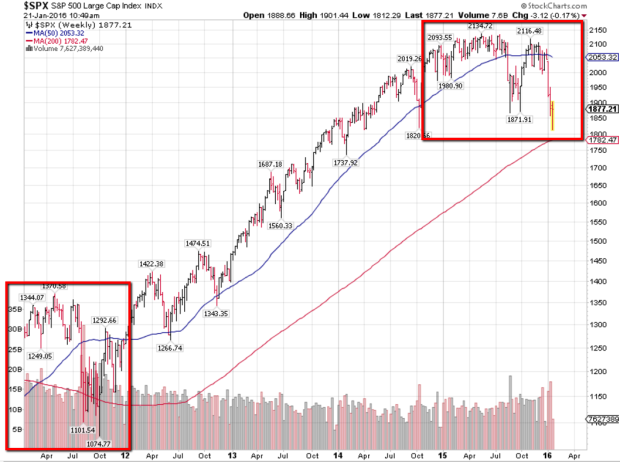
The chart above shows the S&P on Wednesday reached a level where the sell off matched the size of the 2011 “mini bear market”, which consisted of an intraday high to low drop of 300 points or 21% total. So although the S&P at this point has only fell about 14%, it matched the size of the 2011 correction by dropping 300 points off the highs of 2015.
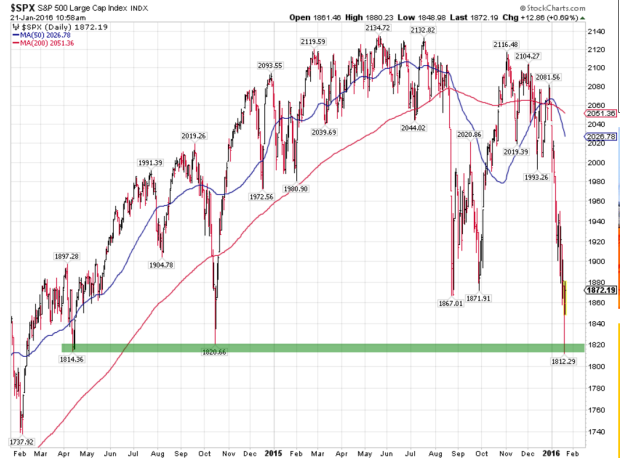
We add in the fact that 1814-1820 was technical support, and we have the makings of at least a short term reversal.
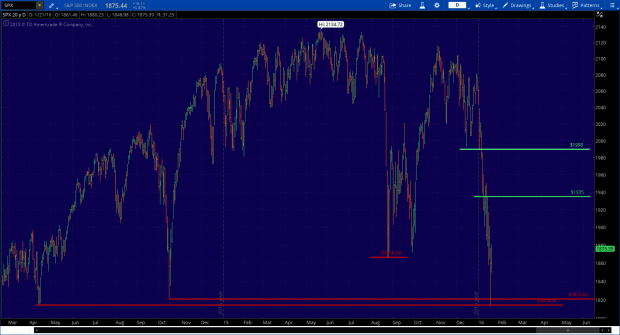
So where do we go from here? My guess would be a rally to at least 1935 and as high as 1990. These are the two main pivots I will be watching in order to gauge if this is just a retrace rally into the next sell off, or the beginning of a new uptrend.
If this is the beginning of a new uptrend, I expect it to push the market up to Dow 20,000 before all is said and done (another 25% higher from current levels). First things first though, we must reverse the downtrend left behind from this dismal start to the new year.
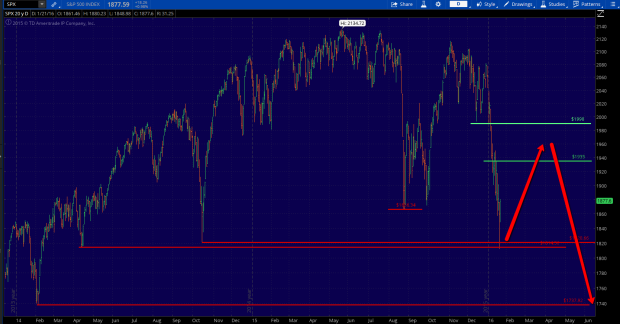
A failure at either of these two resistance levels would setup the potential for another lower low in the vicinity of the mid to low 1700’s. This would then match the size of the 2011 decline of 21% and also falls in line with a support pivot and the 38% retrace level of the 2011-2015 bull market.
Given the below average risk of recession, I expect this would be the worst case scenario going forward, with the best case obviously being that the low is already in place.
Going forward the key macro elements will be the need to see stabilizing oil prices, return to corporate profit growth, and a continuation in accommodative monetary policy.


Leave A Comment