Indian share markets witnessed selling pressure in the final hour of trade to finish just below the dotted line. At the closing bell, the BSE Sensex closed lower by 71 points and the NSE Nifty finished lower by 18 points. The S&P BSE Mid Cap finished down by 0.1% while S&P BSE Small Cap finished down by 0.2%.
Losses were largely seen in realty stocks, capital goods’ stocks and bank stocks.
Asian stock markets finished in red as of the most recent closing prices. The Nikkei 225 & the Hang Seng fell 1.01% and 0.78% respectively. European markets are mixed to lower. Shares in London are off as the FTSE 100 drops 0.35%. The DAX is down 0.07% while the CAC 40 in France is unchanged.
Rupee was trading at Rs 64.52 against the US$ in the afternoon session. Oil prices were trading at US$ 61.83 at the time of writing.
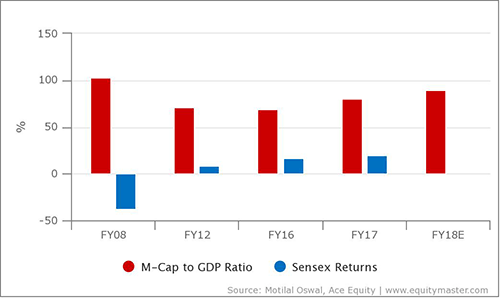
The Market cap to GDP ratio for Indian companies too is close to dangerously high levels. While this is still some way off the peak of FY-08, when it had once reached close to 150, it’s relatively high.
FY17 saw this ratio reach close to 80. It is also expected to increase further given the moderate growth expectations in India’s GDP for FY18. Warren Buffett once considered this as one of the best valuation metrics to gauge the markets.
Past history shows some correlation between the ratio and the share market. 2008 saw Sensex decline by 38%, when this ratio crossed the 100 mark. Also, the market has bounced back sharply when this ratio was low.
The Warren Buffett Indicator Suggests Indian Equity Market Is Overvalued

The basic assumption in this ratio is that whenever the GDP of the country grows, the market performance will reflect it. Also, when stocks do well, it can be extrapolated to assume the Indian economy is doing well.
In news from banking sector, as per an article in The Livemint, credit rating agency Moody’s placed Punjab National bank (PNB) under review for downgrade following the biggest scam in the country’s banking sector to the tune of Rs 113.4 billion.


Leave A Comment