
The headline residential building permits slowed and construction completions slowed relative to last month. But we keep our eyes on the rolling averages which told us this was generally a slightly stronger report than last month.

Analyst Opinion of Residential Building
The backward revisions this month were slightly upward.The nature of this industry normally has large variations from month to month (mostly due to weather) so the rolling averages are the best way to view this series – and it shows permits rate of growth slowing and completions rate of growth now slowing.
Likely much of the decline for September was due to weather (Hurricane Florence).
We consider this a slightly stronger report relative to last month – as the rolling averages improved (even if they are in negative territory).
Over time, there is little difference between using permits or starts to compare to completions.
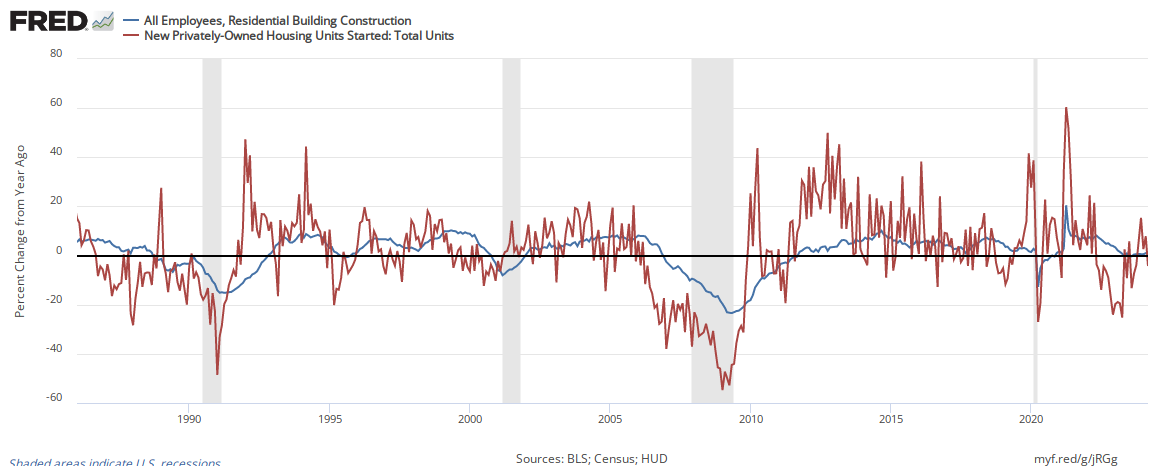
Looking at residential construction employment, the year-over-year growth of employment has a reasonable correlation with housing starts.
3 month Rolling Average for Year-over-Year Growth Unadjusted Data

Econintersect Analysis:
US Census Headlines:
Note that Econintersect analysis herein is based on UNADJUSTED data – not the headline seasonally adjusted data.


Leave A Comment