
Trading opportunities: Since hitting a high of 67.70 USD, the market has transitioned into a phase of downwards movement. Cycles and calculations suggest that the drop from the 13th of February isn’t complete. I reckon that this downwards correction will continue through the 11th of April and stop at around 57.80 USD (50% of the growth from 44.34 to 71.25). We expect to see 2 upwards corrections over the course of the next 40 days. If the daily bar closes above 67.86 (high from 26/02/18), the case for a drop will disappear.
Background
On the 18th of December, I was expecting to see a breakout of the TR1 and TR trend lines followed by a decline in oil prices to 57.80 USD by 05/02/18. The drop to 61 USD should have created a sell signal. In actual fact, the price rebounded from the TR1 trend line and the bullish trend was strengthened. After news of OPEC+ extended their agreement to the end of 2018, oil prices rose to a high of 71.25 USD.
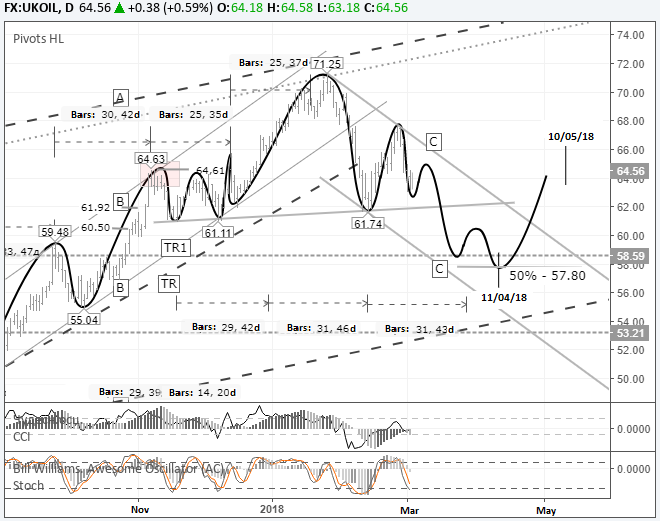
Fig 1. Daily chart. Source: TradingView
Buyers started cashing in on their long positions after the TR1 trend line was broken through on the 5th of February, 2018. Oil prices were pushed down by a declining dollar. After breaking through the TR1 line, sellers broke through the TR line on the 8th of February.
The sell-off stopped at 61.74 USD, after which prices recovered to 67.60 USD. As of now, Brent oil is trading at 64.56 USD per barrel against a minimum of 63.17 USD (01/03/18).
Oil prices came under pressure after the US posted an increase in both oil reserves and crude production, as well as from President Trump’s announcement of import tariffs on steel and aluminum.
On Friday the 2nd of March, trading on Brent futures closed slightly up. Prices rebounded, but according to cycles, the decline isn’t over yet.


Leave A Comment