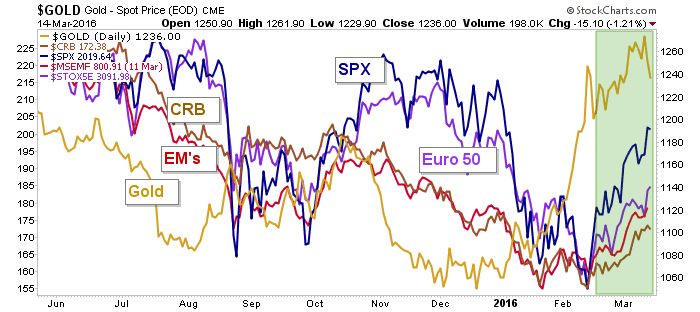
Look folks, I realize that the last month has been fun for everybody with stocks and commodities bottoming and joining the bounce party. Reproducing the Multi-asset chart from NFTRH 386 once again, we see that gold led the whole thing by a couple of months and as of this morning’s pre-market post was pretty much still in line. Well, a $15 shave today and it’s looking more suspect.

The stock market is its own animal now with policy front and center and bullish momentum in play, but commodities and the ‘inflation trade’ mini hysterics that cropped up over the last few weeks are in my opinion, very late stage. Gold is wobbling a bit under the weight of its bearish CoT structure and silver, which should be more inflation sensitive than gold (i.e. more pro-commodities) has only begun to bounce vs. gold recently.
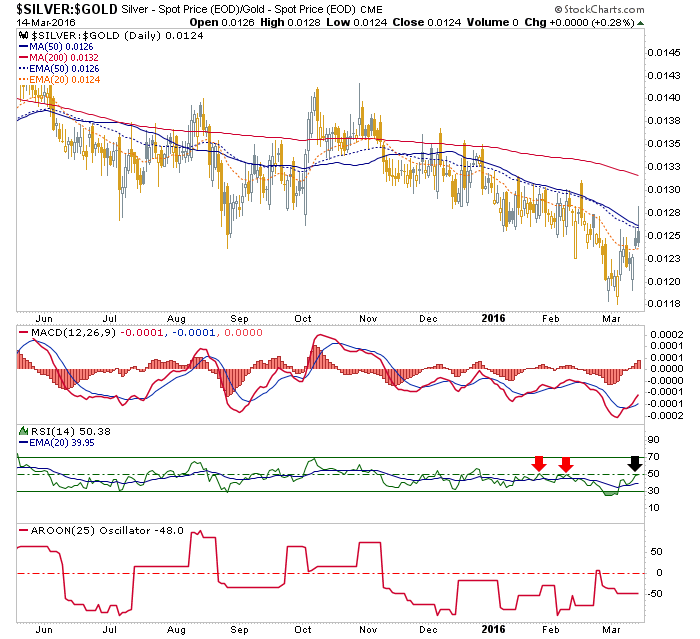
Indeed, silver has bounced vs. gold during the best of the commodity pump, but as we have taken pains to note in NFTRH, the silver-gold ratio has gone nowhere. Not by the weekly charts we review every week…

…and not by the daily either.


Leave A Comment