Silver prices as this is written (March 23) are down 60 cents on the day. Scary … no, probably a normal correction.
Yes, paper silver prices on the COMEX are “managed” for the benefit of traders, banks and others large enough to manipulate the prices.It makes sense that if a bank, which owns the regulators and can “work” the prices to their advantage … will do so.
The solution for small investors:
HOW DO WE DETERMINE SILVER LOWS?
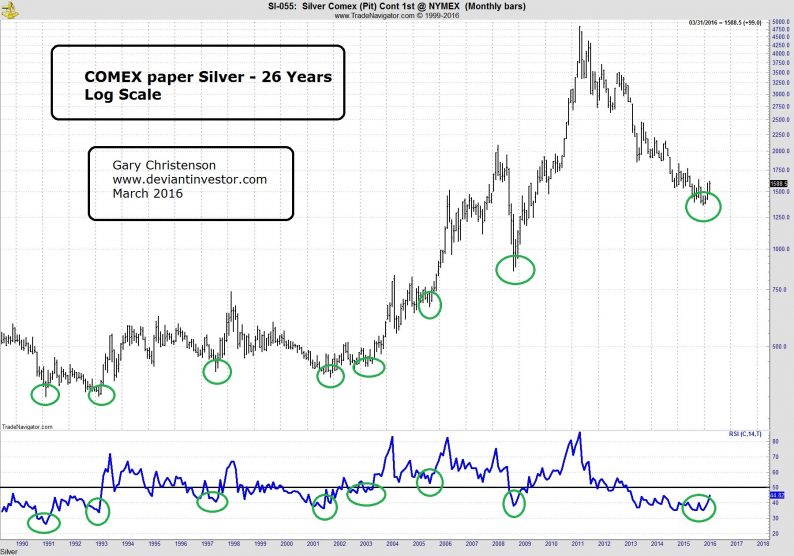
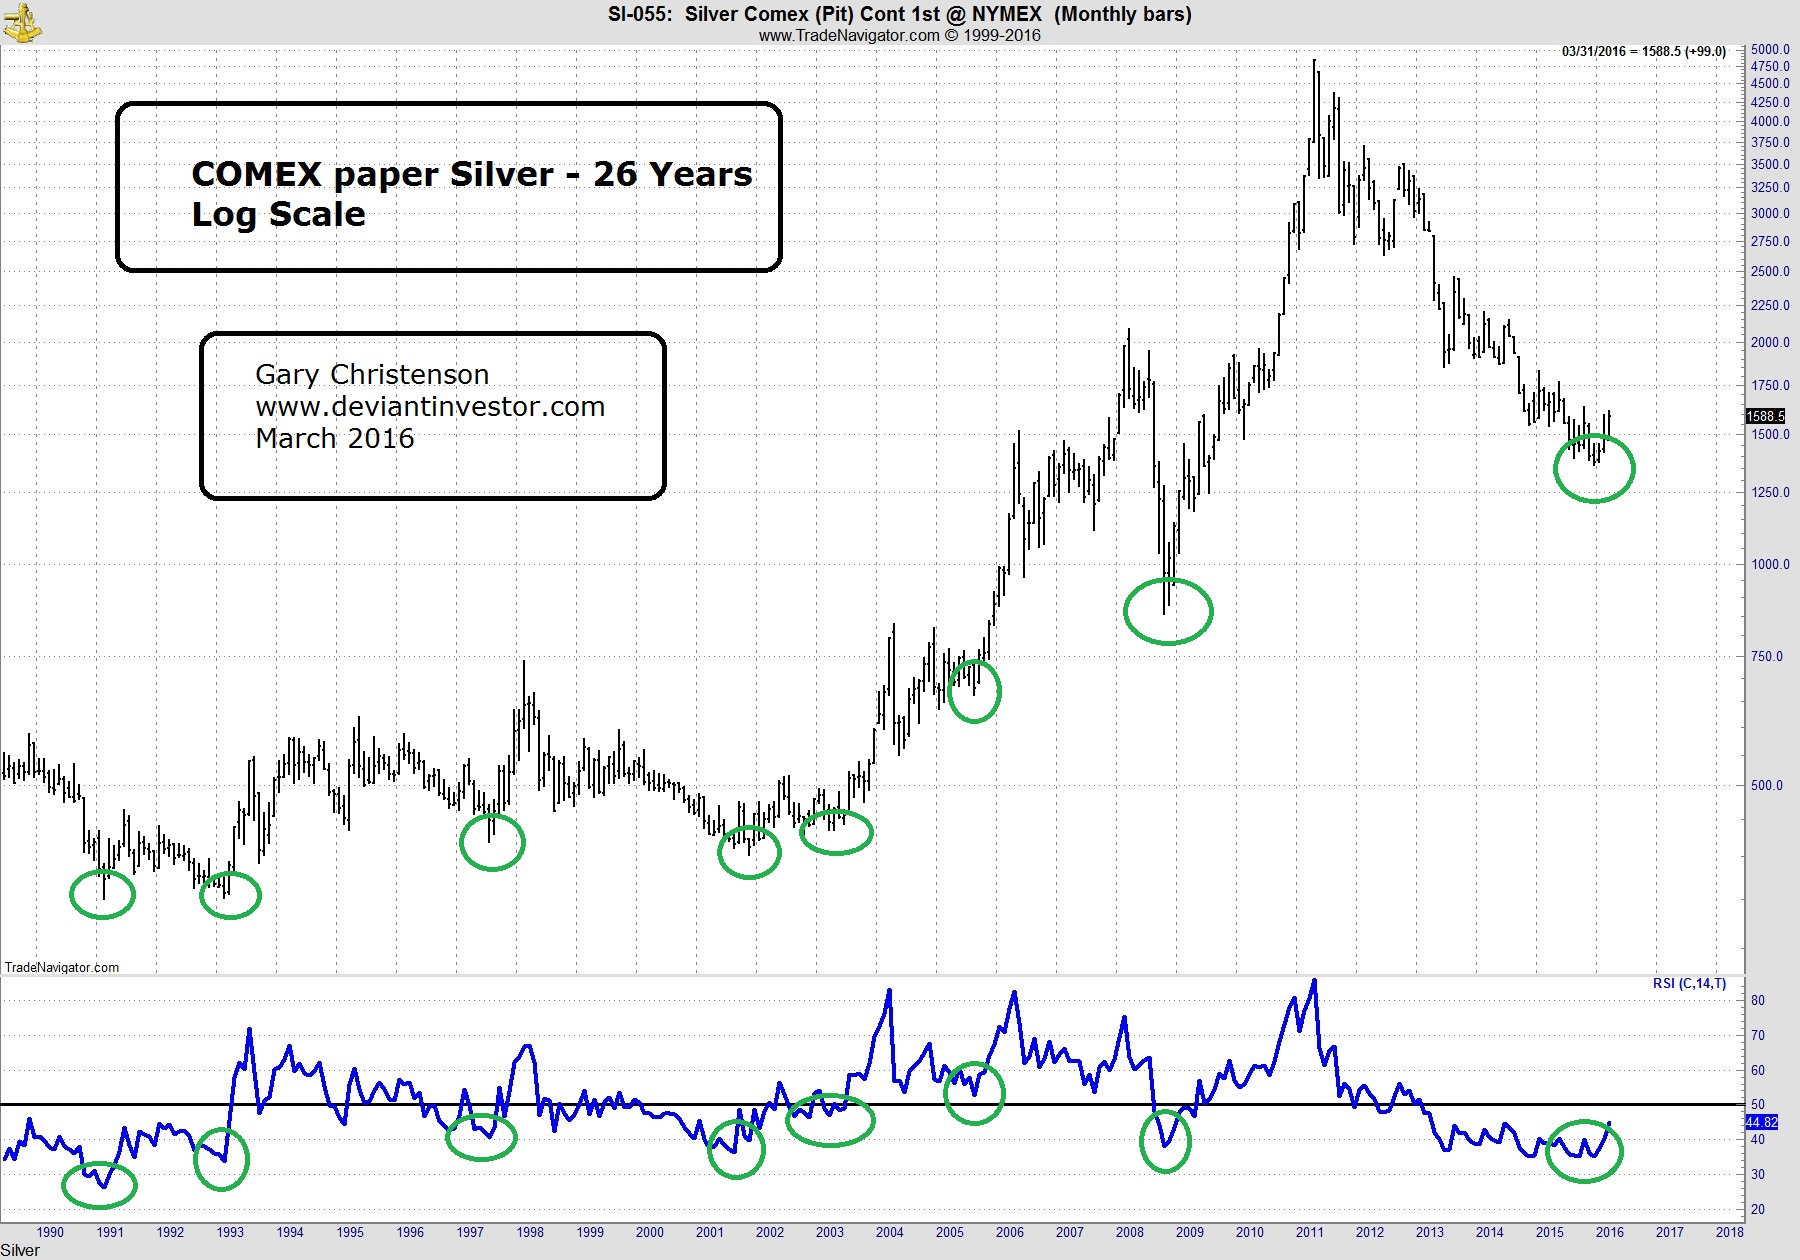
Examine the chart of COMEX paper silver prices on a log scale over 26 years. I have noted the eight most important lows – in my opinion – with green circles.
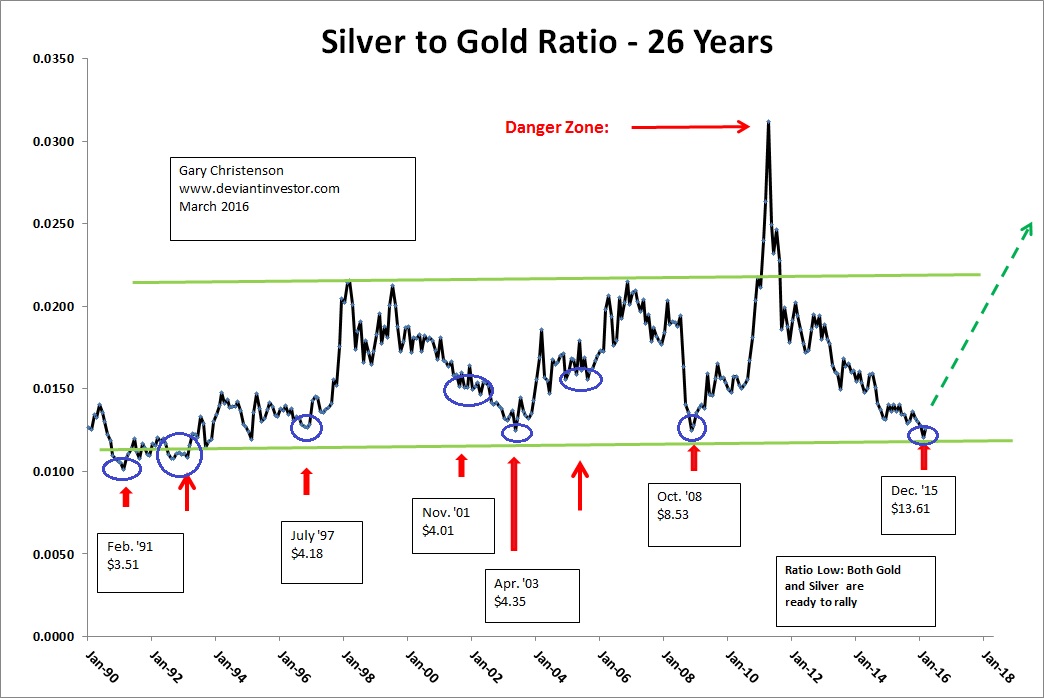
Examine the silver to gold ratio over the past 26 years. Lows in the ratio are good indicators of lows in the actual silver price. Note the purple circles that correspond with the lows in the above silver chart.
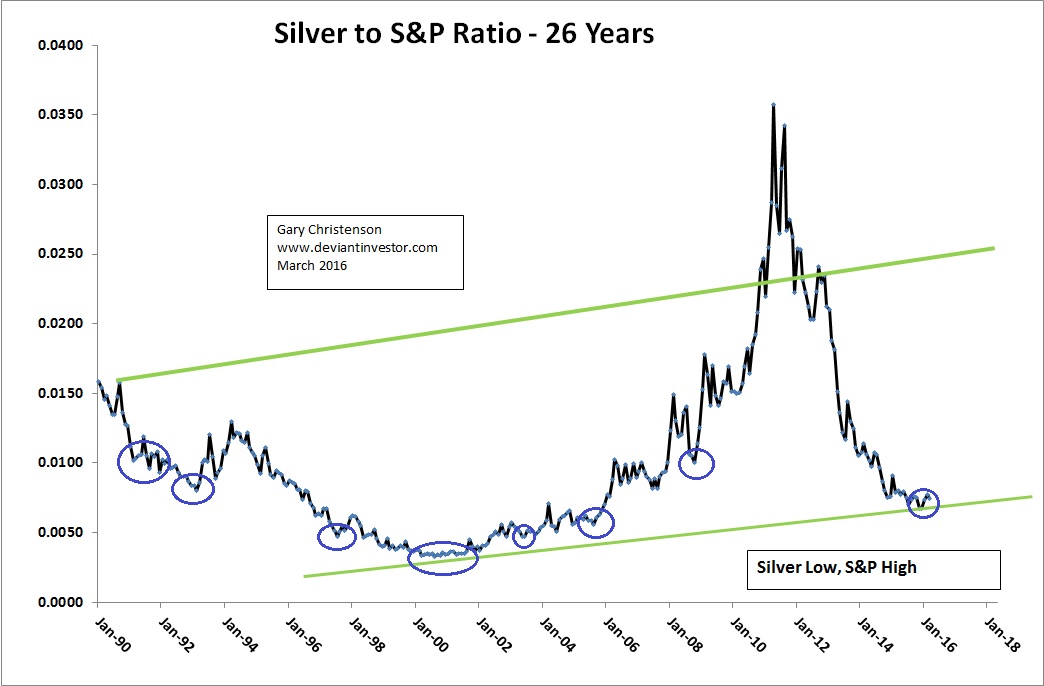
Examine the silver to S&P 500 Index ratio over the past 26 years.Lows in the ratio have generally indicated lows in the silver price.Note the purple circles that correspond with the lows in the above silver chart.
Examine the first chart of COMEX paper silver prices and note the Relative Strength Indicator (14 months) at the bottom of the chart, and note the green ovals.This timing indicator on long term charts accurately indicates silver lows.
The dates for the above silver lows are listed in the following table using monthly data:
Date Silver Lows Silver to Silver to RSI
Gold S&P 500
2/91 $3.50 2/91 2/91 – 12/91 2/91


Leave A Comment