This Silver Market update is the companion update to the Gold Market update posted several days ago.
Overall, silver’s charts looks more frail and negative than gold’s at this time, which is normal at this stage in the cycle, because silver tends to underperform gold in the late stages of sector bear markets and the early stages of bull markets. The 6-month and 10-year charts that we are going to look at below are enough to make an investor in the sector want to jump off a bridge, yet as we will see, it is just when things look at their worst that they often take a turn for the better, as in the old saying that “it is darkest before the dawn”, and as we will proceed to see, there are various indications that a new sector bull market will be born soon.
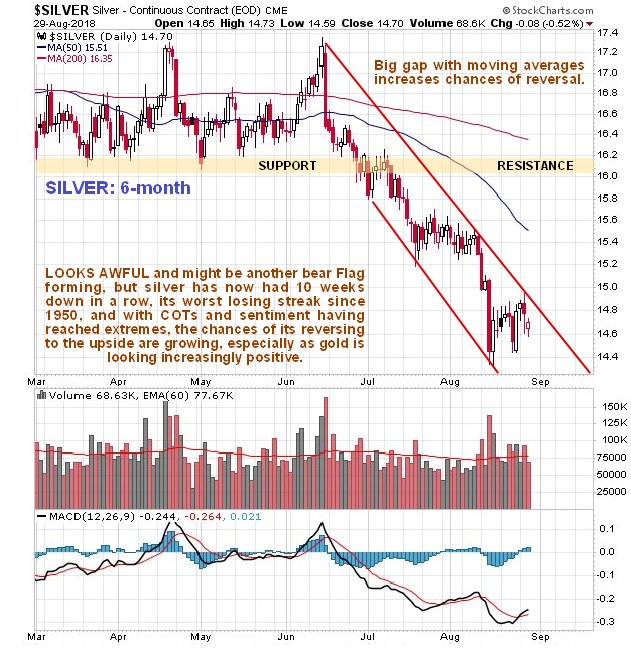
On the latest 6-month chart we can see that silver remains in a quite savage downtrend that began with the breach of an important support level late in June. Going on this chart alone it looks like another bear Flag is forming that will be followed by another step down to new lows. While this could yet happen, COTs and sentiment indicators, especially in gold, are indicating an increasing chance that it will soon break out of this downtrend to the upside, with the chances of this happening improved by the now large gap with the moving averages and the fact that silver is at a support level that we can define on its 10-year chart. Here it is worth noting that silver has suffered 10 weeks down in a row, its worst losing streak since 1950.

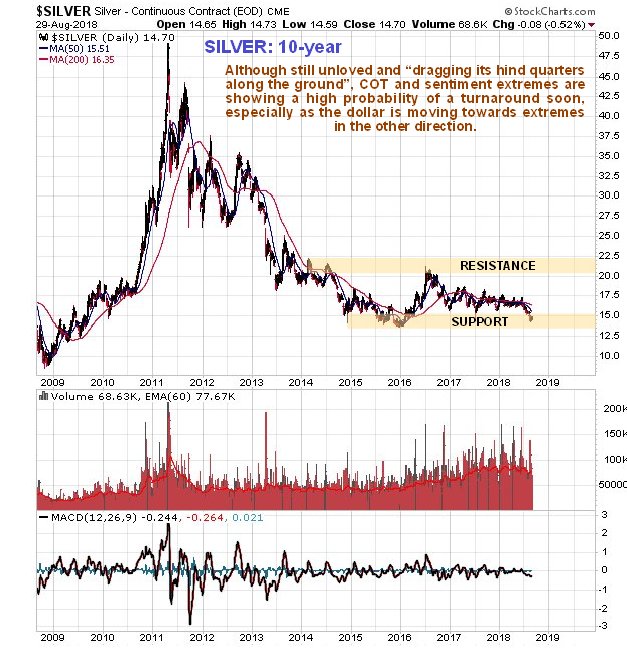
The 10-year chart about as unexciting as it can get, with the failure of the support level shown on the 6-month chart back in June leading to the price stepping down to the next major support level close to the lows in late 2015. Unless all markets suddenly crash, COTs and sentiment indicators for silver are showing that these lows should hold, which means that we are about at the lows now.
The latest COTs for silver make for interesting viewing, especially as, unlike back in the Spring, they are buttressed by gold’s COTs also being impressively bullish at this time. In the Spring, Commercial short positions in silver shrank to a very low level, and the normally wrong Large Specs started going short to a significant degree. This is a situation that normally leads to a sizeable rally, but nothing much came of it. Instead, on a modest rally in mid-June, the COT structure dramatically worsened, which presaged the breakdown and downtrend that followed. Now we find ourselves with the COT structure looking similar to the way it did in the Spring, but with one big and vitally important difference – the gold COT is also strongly bullish now, whereas back in the Spring, it was still bearish. Gold’s COT has the best structure since way back in 2001. What this means is that the next rally should be the “real deal” and not a fakeout like the last one.


Leave A Comment