
 The EconomyLast Friday morning we received the February jobs report. Job growth once again smashed expectations, but unemployment jumped to 3.9% due to recent corporate layoffs. It is interesting to note that much of the job growth is due to Government hiring and people seeking a second or even third job and being counted twice/three times. See job growth chart below:
 The above February job report shows steady job growth along with enhanced pay gains. This is fueling investor confidence that the US economy has reached a sweet spot without much risk of a re-acceleration of inflation in the shorter term.That was the GOOD NEWS.Now the BAD NEWS:Job cuts at U.S. companies in February reached their highest level since 2009, according to the monthly layoff report from Challenger, Gray & Christmas.“Businesses are aggressively slashing costs and embracing technological innovation, actions that are significantly reshaping staffing needs,” Andrew Challenger, a labor and workplace expert at Challenger, said in the report. See chart that follows below:(We will address these “technological” advances shortly in this Outlook).
  Employers primarily cited “restructuring” as the cause of the layoffs. An example of this can be seen in high profile tech layoffs at companies such as Google. The tech giant, and one of the vital components of the Magnificent 7 (more on this later), announced significant layoffs in January as part of their large-scale reshuffling, saying the company is shifting to “invest in our company’s biggest priorities”. A month earlier, the company launched its AI bot Gemini. We surmise that this new AI program is heavily powered by Nvidia semiconductor chips.Other big tech companies such as Microsoft, Apple, Amazon and Meta have all announced cuts this year just as they look to ramp up their AI efforts.Job cuts in tech are much lower than they were last year. In February of 2023, nearly one third of all job cuts came from tech companies. This year, other industries have begun to begin large job cuts. These industries, including manufacturing and energy, are incurring layoffs that are 1,000% more than were enacted during 2023. Below is a list of the industries and their projected job cuts for 2024:
 This week, we also got testimony from Federal Reserve Chair Jerome Powell, who said that the Central Bank is getting close to the confidence level needed to start lowering rates. His comments reinforced the Fed’s new pivot from the chapter that began during the pandemic and was exacerbated by rising costs from Russia’s war on Ukraine.Many investors had thought the Federal Reserve would start lowering rates this month, since the current inflation is around 3% and the 10-year bond yield is over 4%. We think the inflation challenge is not done yet, as the forecasts have changed for longer periods than 1 year ahead, and inflation expectations may still pose a long-term risk to the economy.We think that this has kept the Fed in a more hawkish stance and that we will not see interest rate cuts until June or beyond. (we could be wrong). See chart below:
 The MarketsEarlier in the week, with the continued upward movement of technology stocks, it looked as if the S&P would close for the 17th positive week in 19 weeks. But such was not the case when the market turned down on Friday afternoon led by a selloff in the afternoon. See the 21-week chart on the S&P below.
 Nvidia (NVDA), which has been on a tear (along with other semiconductor stocks – more to follow on this), had a 10% move on Friday from peak to trough. See chart from Friday below:
 However, all the major markets remain positive and healthy year-to-date. The strength of the returns since October 2023, has historically led to more gains going forward. See the S&P 500 illustration below:
 But, as we will point out in the Technology overview below, it may be time for investors to exercise some caution.While you would probably expect to hear that the long-term movement of the S&P 500 since the Great Financial Crisis and bear market of 2008-2009 has been strong, the size of these long-term gains may surprise you. See chart below:
 The major driver of the marketIn hindsight, investors realize that there was a significant turning point when the markets trajectory went from down to up. That started in November 2022 with the realization that we were entering a period of accelerated technological development through the innovations of AI (Artificial Intelligence). Two weeks ago, we discussed in detail the Nvidia story and the impact it is having on the economy, the markets, and other tech companies. If you missed that article or want to review it, go here.Nvidia has not only soared to incredible heights, but it has also lifted many other semiconductor companies that are part of the industry’s success or are working on their own innovation, development and strategy in the AI field.For a helpful way to understand the key economic and market trends, you can follow Mish’s Economic Modern Family, which shows how each major sector contributes to the economy.Mish explains how the market moves up or down in response to economic factors in her book “Grow Your Money Tree.” She shows how each sector (and character) of the Modern Family represents a part of the US economy and how they affect the stock market’s performance, positively or negatively.You can learn more about the Modern Family here, and you can get a copy of Mish’s book here.This is how Mish describes this all important semi family member:Semiconductors (SMH) “Sister” – The semiconductor industry is on the forefront of innovation and a major player in many of the strongest technology trends.The rally that Sister Semiconductor has had since the end of 2022 has been nothing short of spectacular. Every time you think the sector is taking a breather, it turns around and rallies another few percent. On Thursday, the Philadelphia Semiconductor Index (SOX) closed more than 17% above its 50-day moving average and 36% above its 200-DMA.Regarding the 50-day moving average, it has not ever traded down to within 3% of that level in the last 80 trading days. Look at the SOX index for the last 12 months:
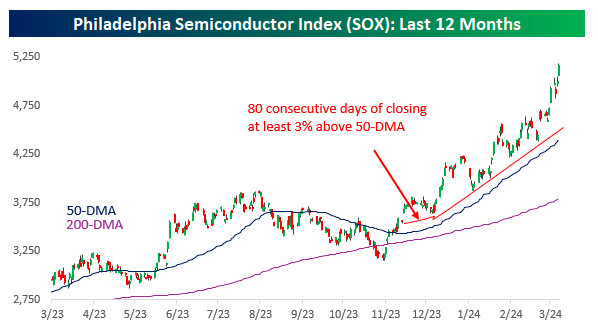 Another chart below shows the current streak of positive performance as the longest since the days coming out of Covid and just the fifth time in the index’s history since 1994. The longest streak ended at 143 trading days in August 1995.In looking at the four prior streaks, once they reached the 80-day point, the forward one-year performance of the SOX was mixed with a median gain of just 3.1% and positive returns just twice. This also could be a cautionary tale.
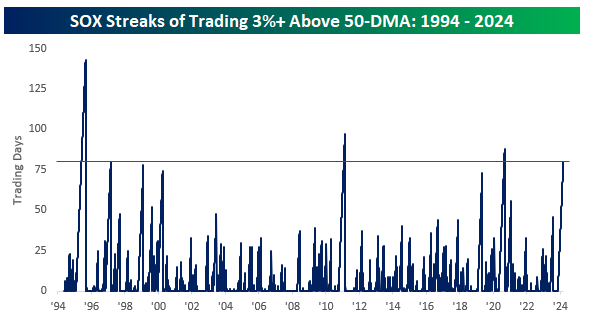 Thursday was a monumental day for the semiconductor sector because it was also the first time in its history that the index closed at a higher price than the S&P 500. It got close in 1999 but never quite got there.The rally in semis over the last few years has been nothing short of amazing, but the slope of the ascent in the ratio back in 1999 and 2000 was a straight up. The good news is this one is not. That may help the semiconductor sector to continue to go higher yet. Or, as many investors believe, we could be near a top.
 Recent targets and then stops suggest to us that we could be seeing a much-needed pause or even correction in the Chips area. Please be careful. Mind your stops, use hedges like inverse ETFs, or even purchase puts or sell calls against your profitable positions as we get through the next few weeks. Can the tech rally continue?This past month has seen one of the largest outflows of capital out of technology. This may have a “pause” effect on this sector as investors begin to take profits. Part of the reason that the mega-cap tech stocks have continued to rally is that more of the public has been putting in significant inflows into the major indices (the cap-weighted S&P 500 and the Nasdaq 100). The indices automatically purchase the largest mega-cap stocks that make up the indices.See tech flow chart below:
 The Magnificent 7 has become the Fabulous 4 This week Larry Benedict wrote about the breakdown in several of the Magnificent 7 stocks. Knowing that there has been a rather large amount of money flowing out of technology dedicated stocks and ETFs along with the fact that investors are sitting on huge gains, may provide caution that the Tech rally may see a much needed pause in the next few weeks.Larry stated the obvious this week. At $2.3 trillion, Nvidia’s current market cap is almost double where it was at the start of the year when it was at $1.2 trillion. And we are only in the beginning of the third month of 2024.What’s more is Nvidia is now three times the size of Warrant Buffett’s Berkshire Hathaway (BRK-B) which is worth around $900 billion and is the US’s seventh-largest stock. Nvidia has also surged past Meta Platforms $1.3 trillion, Alphabet $1.7 trillion and Amazon’s $1.8 billion valuations. And who knows, it may soon surpass Apple’s $2.6 trillion valuation sometime this year?But get this, most of these companies make products and offer services that permeate every part of our lives. Nvidia just makes CHIPS. Yes, great innovative and world-class CHIPS, but just one product. That is the power of Sister Semiconductor in our lives, at least for the moment.Of the 7 stocks that make up the Magnificent 7, Amazon, Meta and Microsoft continue to be in strong uptrends. Not surprising given that these 3 stocks are using advanced AI as part of their operational efficiencies (AMZN) or as part of their business services and offerings (MSFT & META).The other 3 stocks that made up the Magnificent 7 have been losing some steam. See charts below:

 Other opportunitiesIn a December Market Outlook, I gave my predictions for 2024. I focused on a couple of areas that I thought might be good places to invest in US stocks and ETFs. They included:
This week, we saw a breakout in Gold. This is probably long overdue, but it is happening with interest rates staying elevated. This is surely a good sign for GOLD bugs and avid followers. (It is also one of Mish’s favorite recommendations.)While Gold is drawing new attention, according to what I have read, it is mostly rising because of currency devaluations around the world. The US dollar is losing value against other currencies like the Japanese Yen, and that is having a positive effect on driving Gold prices higher.The largest ETF for Gold has seen record amounts of OUTFLOWS since the beginning of the year. If Gold’s recent breakout attracts some or all this money back into the ETF, we could really see the GOLD market (and ETF) take off.The consolidation of Gold has been in the making for years. This breakout from a CUP and HANDLE could push the price of Gold into the mid 2,000 area as much as $2,500 to $2,700 given the surge from the bottom of the cup in a measured move above the breakout of another $500-$600. Don’t get left at the train station if this continues higher.

 Two other areas of opportunityAs I mentioned above, Value stocks look ripe to begin moving higher. We saw this on Friday as the Utility and Consumer Staples sectors, two areas that are the bellwether of VALUE stocks, were positive on the day when most other sectors were negative. This may be an early indication that Value stocks may be coming back in favor.According to Grantham Mayo, one of the largest Value managers in the US, Value stocks are extremely cheap compared to the rest of the market. One way to take advantage of this area is to invest in the ETF- VTV. See chart below:
 Another area of interest continues to be the Small & Midcap areas. Over the past few weeks, we have written several Market Outlooks about this. Please go back and review the archives.Again, midcap stocks, according to the chart below, are currently looking attractive to other areas of the markets.Watch out for the CPI and PPI which will be released later in the week. This inflation data could provide a catalyst for stocks to go higher or lower quickly.More By This Author:Silver is Also a Precious Metal
Update On Sugar Futures
The Long Bonds Could Tell HODLers A Story


Leave A Comment