
The market is in the irrational exuberance stage at the moment as even the Italian bank stocks have been rallying this week. As I mentioned in my last post, the indicators in the economy have improved. However, the market was already priced as if they were improving, so it shouldn’t be rallying as much as it is based on some decent data and a lot of hope for 2017. We will see if Trump can deliver. In this article, I will give you some charts that may give you some pause about buying into the hype machine.
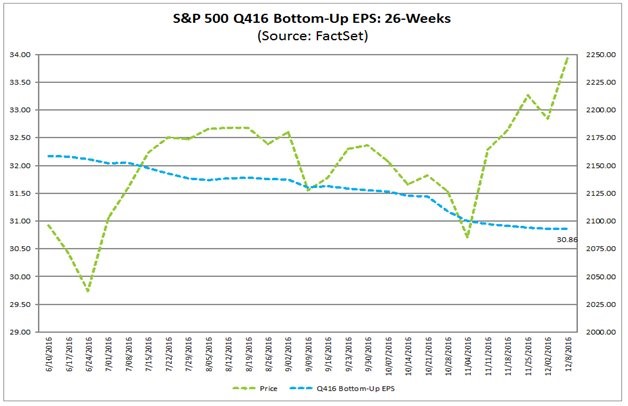
The first chart is from FactSet. It shows the trend in expectations for Q4 earnings. As you can see, the market has rallied while analysts cut their estimates. The current expectations are for 3.3% growth. There is still much ground to be made up from the declines we’ve seen in the past few quarters. Markets are clearly not considering earnings when valuing stocks. There is no direct relationship in this chart and there hasn’t been one all year.
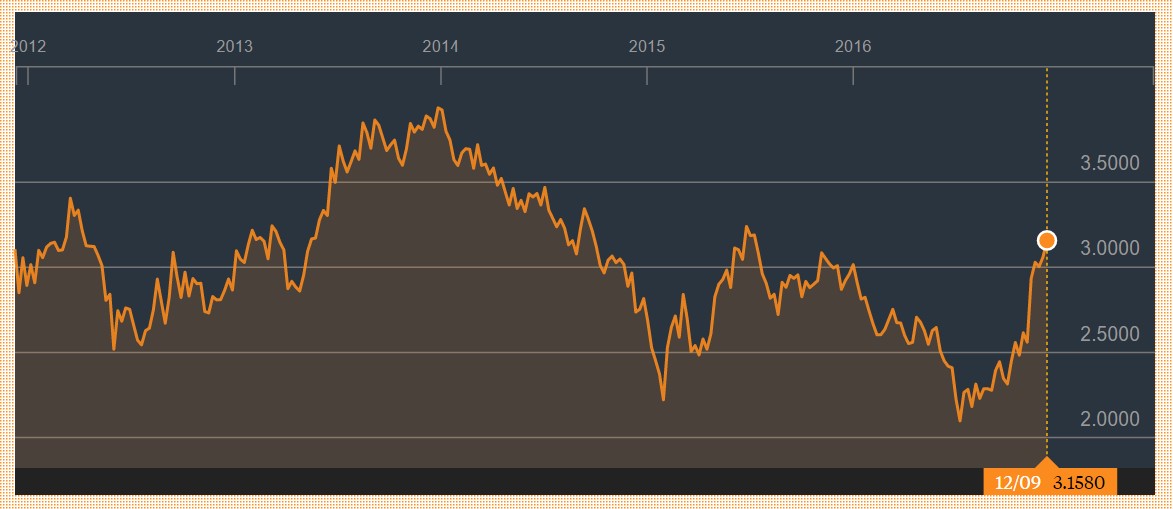
The rally in stocks is being driven by an asset rotation out of government bonds and into stocks. With inflation expectations rising, fixed income investors require higher yields from government bonds. As you can see from the chart below, the 30-year bond yield has increased by over 1% from the bottom in July. The argument for buying stocks because fixed income yields are so low is proving to be correct. The question is how long this rotation can last. Verizon (VZ) stock has risen 10% this month and is now yielding 4.49%. At this rate, we could see the 30-year bond yield meet Verizon’s dividend yield at about 4% in a few months. I was wrong about this asset rotation because I felt both U.S. government bonds and stocks were in a bubble. I didn’t see why investors would move to stocks because they are expensive. However, we are in a TINA (there is no alternative) situation so money is flowing into stocks.
The chart below reviews the various valuation metrics for stocks. Of the 20 metrics 14 show it is overvalued and 6 show it is undervalued. These valuations are from November 30th. The S&P 500 has rallied 2.76% since then, so the trailing normalized PE is now at the historical average. Three of the other metrics showing the market is cheap is compared to bonds. The problem is stocks look cheaper than they are because firms use low interest rates to borrow money to buy back their stock. If interest rates move higher and firms can no longer borrow cheaply, they will look even more expensive than they look now.


Leave A Comment