
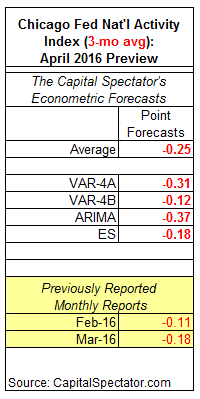
Economic growth has been winding lower lately and the deceleration trend is on track to continue in April, based on The Capital Spectator’s analysis of the three-month average of the Chicago Fed’s National Activity Index (CFNAI-MA3). Tomorrow’s report for the first month of the second quarter is expected to show that the Fed bank’s business cycle benchmark will tick lower. The Capital Spectator’s average forecast of CFNAI-MA3 by way of several econometric estimates calls for a mild decline to -0.25, which is slightly below the -0.18 reading for March. The -0.25 projection is still well above the tipping point that marks the start of recessions, but the negative print continues to point to below-trend growth for the US.
Only values below -0.70 signal an “increasing likelihood” that a recession has started, according to guidelines from the Chicago Fed. Using today’s average estimate for April as a guide, CFNAI’s three-month average is expected to reaffirm that the expansion remains moderately below the historical trend but well above the tipping point that marks the start of a recession. If the forecast is accurate, however, the US macro trend will ease to the slowest pace so far this year, based on CFNAI-MA3 data.
Here’s a closer look at the numbers, followed by brief definitions of the methodologies behind The Capital Spectator’s projections that are used to calculate the average forecast:
VAR-4A: A vector autoregression model that analyzes four economic time series to project the Chicago Fed National Activity Index: the Capital Spectator’s Economic Trend & Momentum Indexes, the Philadelphia Fed US Leading Indicator, and the Philadelphia Fed US Coincident Economic Activity Indicator. VAR analyzes the interdependent relationships of these series with CFNAI through history. The forecasts are run in R with the “vars” package.
VAR-4B: A vector autoregression model that analyzes four economic time series to project the Chicago Fed National Activity Index: US private payrolls, real personal income less current transfer receipts, real personal consumption expenditures, and industrial production. VAR analyzes the interdependent relationships of these series with CFNAI through history. The forecasts are run in R with the “vars” package.


Leave A Comment