In a post yesterday, we highlighted the fact that while large-cap stocks in the S&P 500 were down an average of 13.2% from their 52-week highs, small-cap stocks were faring much worse, with stocks in the S&P 600 Small Cap index down an average of over 20% from their respective highs. Today, we wanted to go into a little more detail on these market cap divergences by looking at how far stocks are down from their 52-week highs within individual sectors.
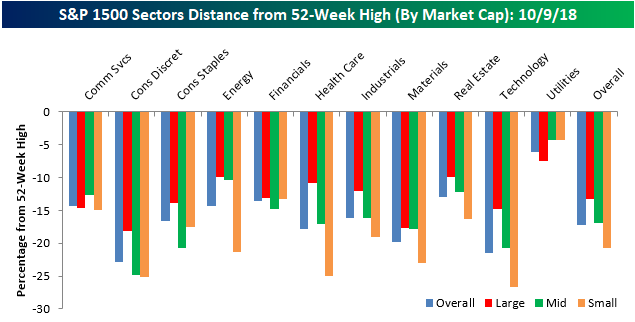
While small-cap stocks are down an average of 20.7% from their 52-week highs, small-cap Technology, Consumer Discretionary, and Health Care stocks are down an average of much more. In the Technology sector, for example, the average spread between where individual small cap tech stocks are trading relative to their 52-week highs is 26.7%, while in the Consumer Discretionary sector that same spread is just over 25%. While stocks in these sectors have sold off sharply from their 52-week highs, stocks in the Utilities sector are down less than 5% on average from their 52-week highs. Utilities is also the only sector where the average small-cap stock is down less from its 52-week high than the average large-cap stock in the sector.
Speaking of large caps, stocks in the Consumer Discretionary and Materials sector are trading down the furthest from their 52-week highs (~18%), while Utilities (-7.4%), Energy (-9.9%), and Real Estate (-9.95%) are the only three sectors where stocks are down less than 10%, on average, from their 52-week highs.


Leave A Comment