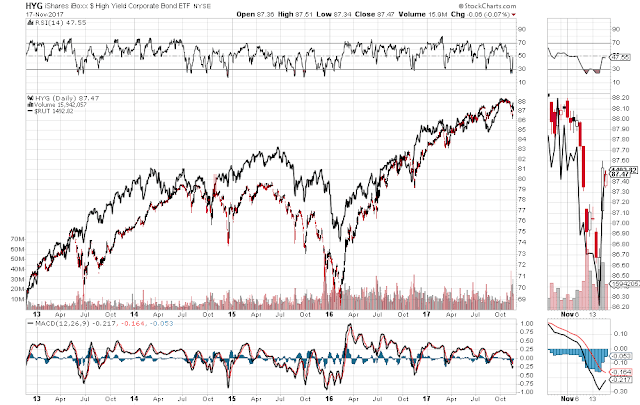
As can be seen on the Daily comparison chart and percentage-gained graph below, the Russell 2000 Index (RUT) and the High Yield Corporate Bonds ETF (HYG) generally trade in lockstep, although the RUT is accompanied by more volatility and larger swings.
At the moment, the RSI and MACD indicators are hinting of lower prices ahead for HYG and volumes have spiked over the past few days.
We’ll see if volatility ramps up and whether any significant weakness hits both of these in the near term…particularly as U.S. Republicans battle to reform and cut taxes before the end of the year.
In this regard, watch for a drop and hold below major price support (and the 200-day MA) on HYGat 86.00 as a potential harbinger of similar fate for Small Cap stocks.


I’d also watch to see whether price on the RUT:RVX ratio falls below the 85.00-105.00 zone (as it bounces in between), as shown on the Daily ratio chart below. Major price support (and the 200-day MA) lie around 85.00 and much higher volatility, and weakness, wait below that level for the RUT.


Leave A Comment