
PPI Inflation Index Echoes Recent Trend
The recent data for February shows inflation isn’t reaching the same rate it was at in January. It appears analysts got too excited about the reports to start the year. Everyone got on the inflation bandwagon because of low unemployment and the length of this business cycle, but those aren’t great indicators to measure the economy. Ultimately, it’s good news if inflation is moderating. All we need now is for the Fed to hike rates twice this year instead of 3 times and we will have an expansion which is longer than the one in the 1990s. The reality is that inflation isn’t just slowing because of the extra slack in the labor market. The other catalyst is the economic slowdown which I’ll be reviewing in the next few weeks.
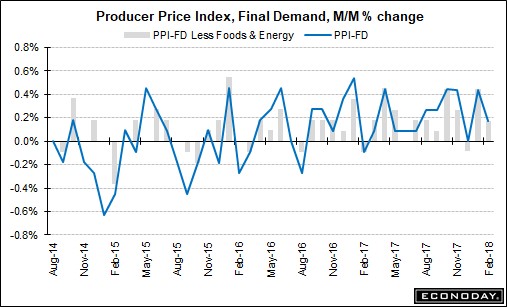
For now, let’s look at the February PPI report. As you can see from the chart below, the month over month change in final demand was 0.2%. That was below the 0.4% increase in January. The year over year change increased 0.1% to 2.8%. Excluding food and energy, the month over month increase was 0.2% which was below the previous month’s 0.4% increase. Year over year core PPI growth was 2.5% which was up 0.3% from last month. Overall, this was a stagnant report which didn’t show acceleration like many economists, who extended the trend line, foresaw. For next month, the consensus is for a 0.2% month over month increase in core PPI and a 2.5% year over year increase. There’s nothing in this report which suggests the Fed should get aggressive and raise rates 4 times in 2018.
As a result of this PPI reading, the 10 year bond yield fell again. It declined 2.56 basis points to 2.817%. It is just one basis point above the recent low it made on March 1st. At that point, I became bearish on the 10 year bond because I was only bullish previously because it was oversold. Even though it’s at the same price, I’m not as bearish as I was 2 weeks ago because of the slew of disappointing inflation and economic data. I wouldn’t be surprised if the yield fell to 2.70% in the next few weeks. The 2 year yield increased slightly, meaning the curve flattened. With the 2 year yield at 2.2578%, the difference between the 10 year and 2 year is now 56 basis points. Technically speaking, the next major point of resistance will be 50 basis points. If it falls below that, the yield curve will instantly become the number one story in the financial press. The headlines alone could cause stocks to decline. The chart below shows the yield curve for 3 separate spreads. They are all rapidly flattening which makes it look like 2018 is either 2005 or 2006 in the last business cycle.


Leave A Comment