After the last two weeks of seeing so many spaghetti models that forecast the potential trajectory of hurricanes in the news, we can’t help but note that the forecasting charts that we show each week really represent a similar concept being applied to the future path of the S&P 500.
Only for us, the difference between the alternative trajectories that the S&P 500 might follow comes down to how far into the future investors are collectively looking at any given point in time, where the base reference points that we’re projecting from are 13 months, 12 months and 1 month in the past.
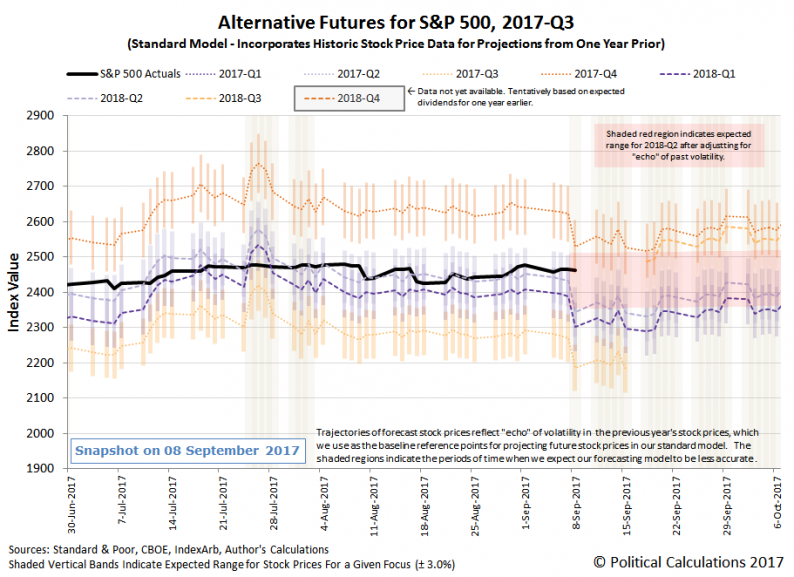
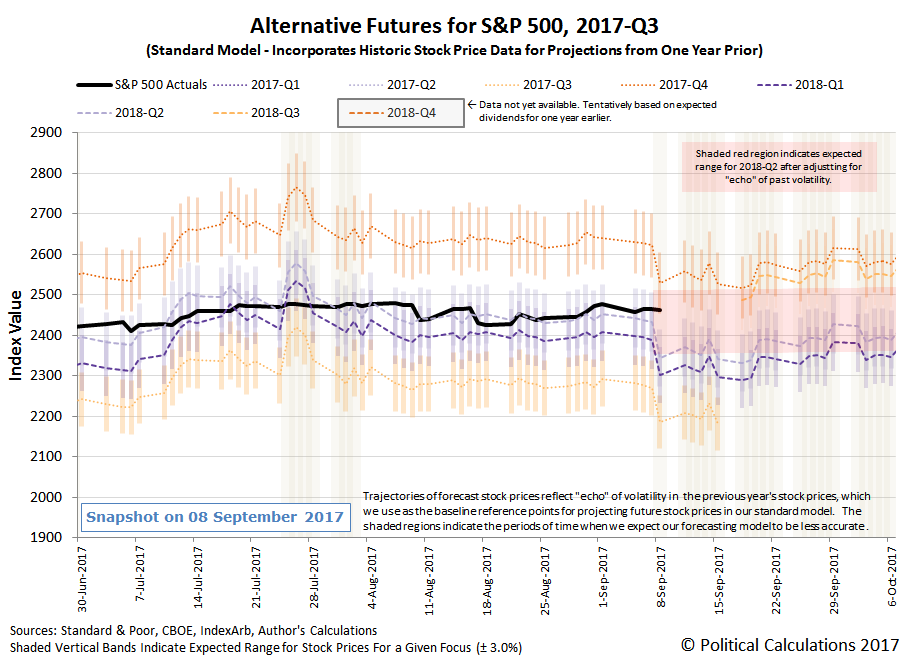
That would seem to be a pretty straightforward proposition, but not always. Sometimes, the historic stock prices that we use as those base reference points reflect have been affected by an abnormal amount of volatility in the stock market, where the echo of past volatility skews our dividend futures-based model forecasts.
Last week, we entered one of those periods, which will affect the accuracy of our raw forecasts through 8 November 2017.
That’s why we’ve adjusted our alternative futures chart for the S&P 500 by overwriting the overall trajectory in which we expect the S&P 500 to fall during the next several weeks, where we’ve assumed that 2018-Q2 will continue to be the point in time to which investors will focus their attention, just as they have over the last several weeks.
Our basis for making that assumption may prove to be very short-lived, however. The CME Group’s Fedwatch Tool no longer anticipates any change in the level of the Federal Funds Rate in the U.S. through the indefinite future (or rather, at least 1 August 2018), where other factors may soon affect how far into the future investors look.
Consequently, we may see greater volatility in the S&P 500 as a result, where breaking news may cause investors to suddenly shift their attention to other points of time in the future.


Leave A Comment