With the disclaimer being that as an intuitive and more artful TA using inter-market ratio measuring tools and the like, I am the furthest thing from an accomplished cycles analyst.Indeed, I am probably less adept at it than you are.
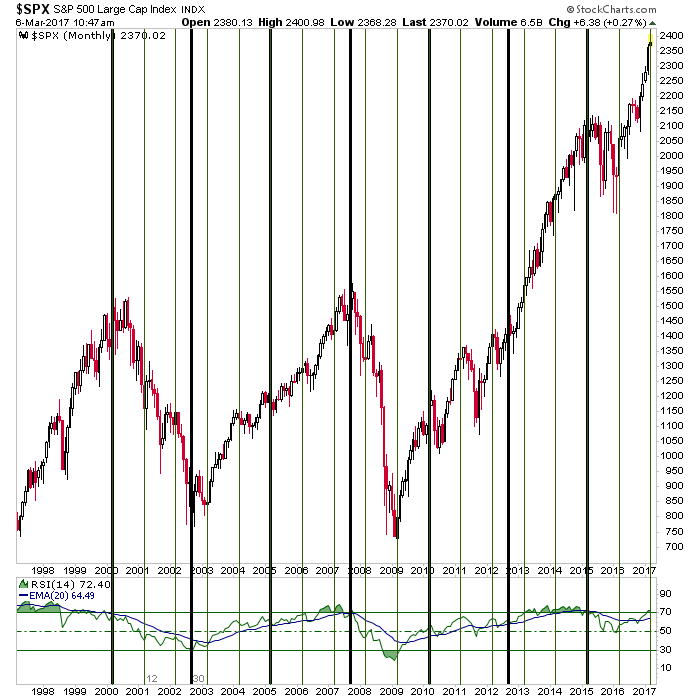
That behind us, I was fooling around with Stockcharts.com’s cycles tool and came up with this monthly view of the S&P 500, with the thick black lines being a 30 month cycle and the thin green lines being a 12 month cycle, each starting from the 2000 market top.
Each cycle has caught some pretty significant turning points with the 30 mo. having caught the 2000 and 2007 tops along with the 2002 bottom and the pre-corrective 2015 top.The 12 mo. cycle seems to have been more adept at spotting interim turning points but it did catch the 2009 bottom.
What we seem to have by the 12 mo. cycle is a top of some kind due now, but the 30 mo. is not due for another 6 months.That seems to jibe well with the idea that we have not yet had a volume blow off (i.e. a climactic volume and bullish capitulation event) and that the real top may be out on the horizon.6 months also happens to coincide with the often problematic month of September.
Sound like a plan?Well yeah, the ultimate top could be out in September/October, but the cycles make no guarantee about the identity of a turning point (top or bottom), so that could also be a date for a low in the market as well.Therefore, the blanks will have to be filled in along the way using the more artful stuff.


Leave A Comment