The stock market and economy move in the same direction over the medium-long term. That’s why it’s extremely important to understand the state of a nation’s economy. Is the economic data improving or deteriorating?
Let’s take a look at U.S. economic data as of the end of September 2018.
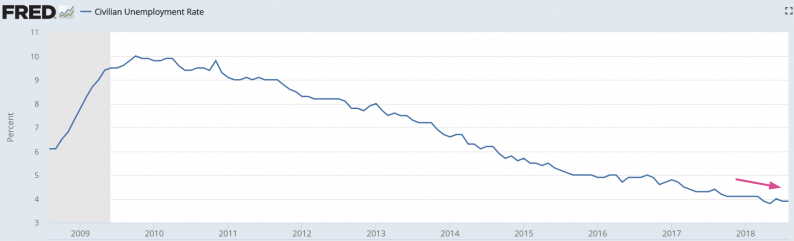
Unemployment
After trending downwards for many years, the Unemployment Rate is finally starting to trend sideways.
The Unemployment Rate has yet to trend upwards, so this is not yet a bearish sign for the stock market and economy.
The unemployment rate is extremely low right now (when compared to history). We aren’t concerned yet, but we are watching out for a sustained increase in the unemployment rate.
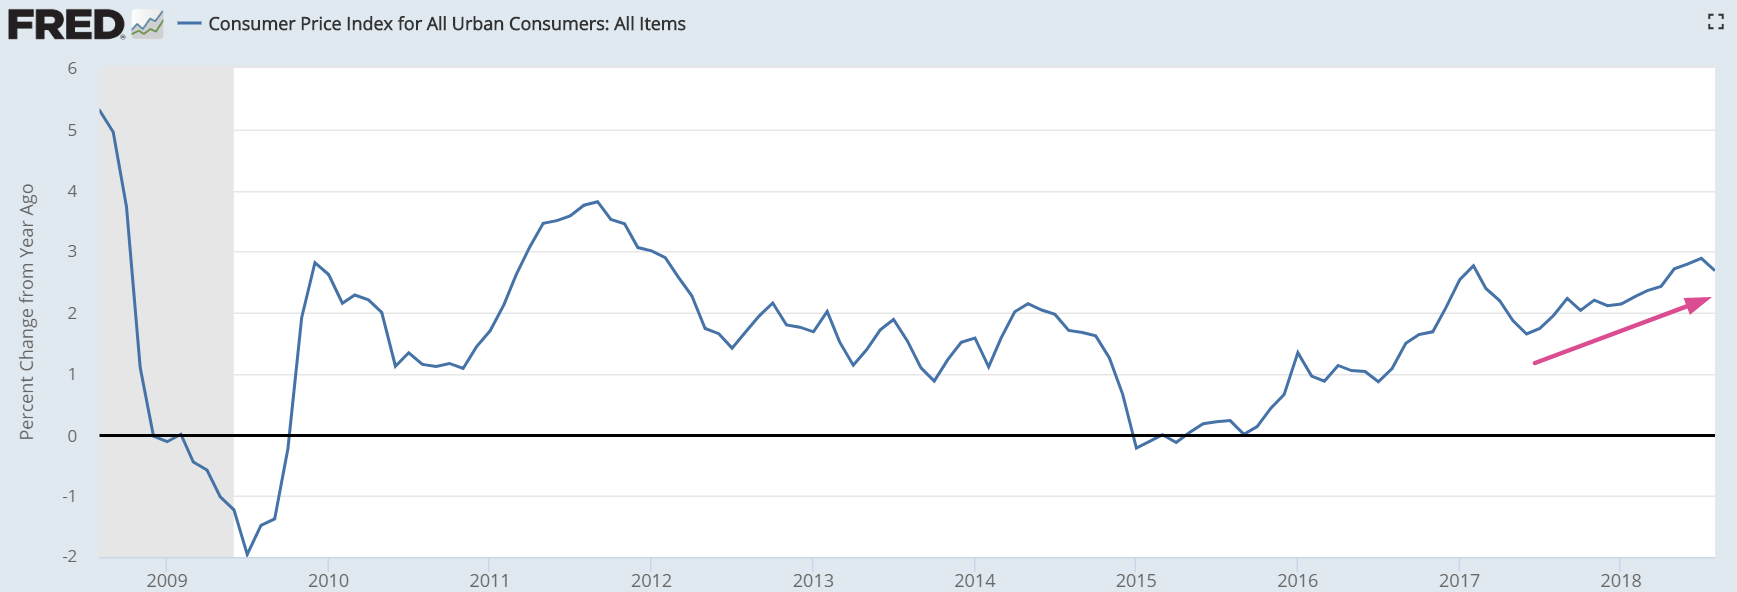
Inflation
U.S. inflation is rising very slowly above 2.5%. Indicators suggest that inflation will swing between 2.5% – 3% in 2018.
*Many investors expected inflation to “surge” in 2018. This is clearly not the case.
Initial Jobless Claims and Continued Claims
Initial Jobless Claims and Continued Claims are still trending down right now. This is a long term bullish sign for the stock market because jobless claims tend to rise before bear markets and recessions begin.
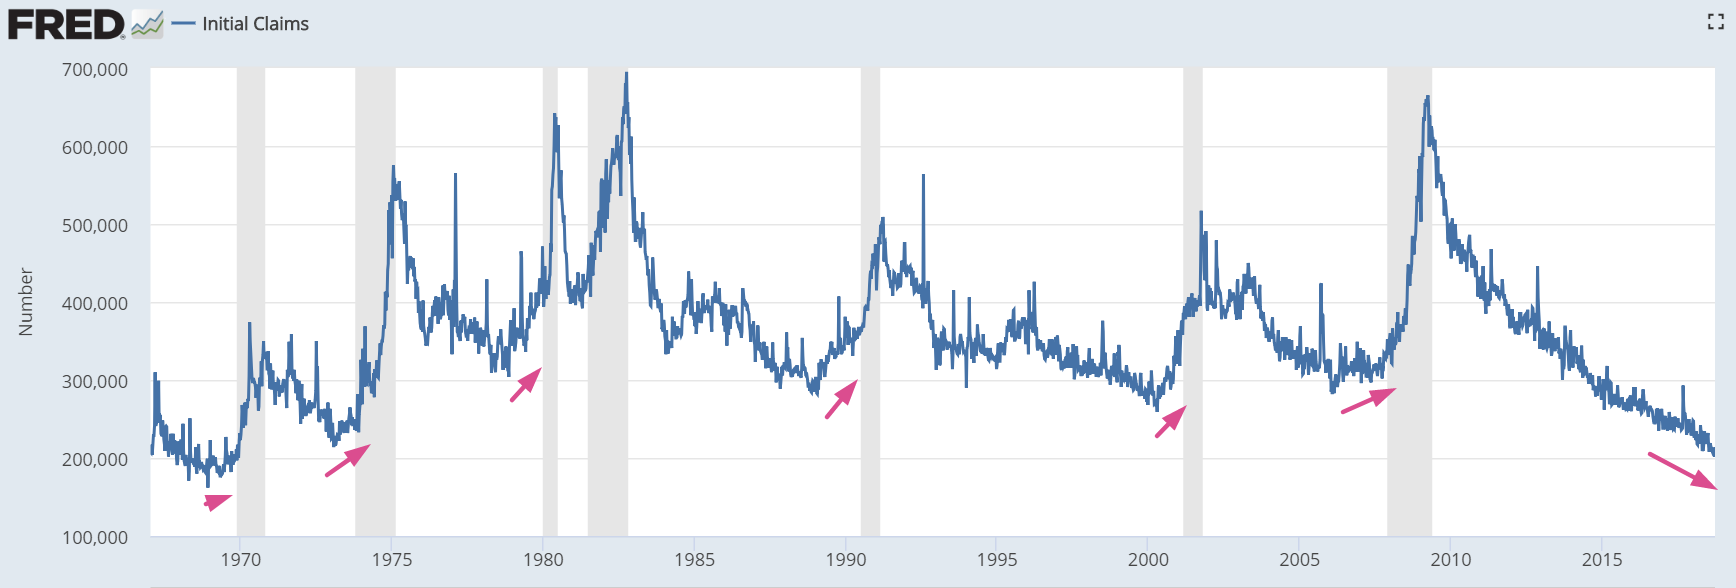
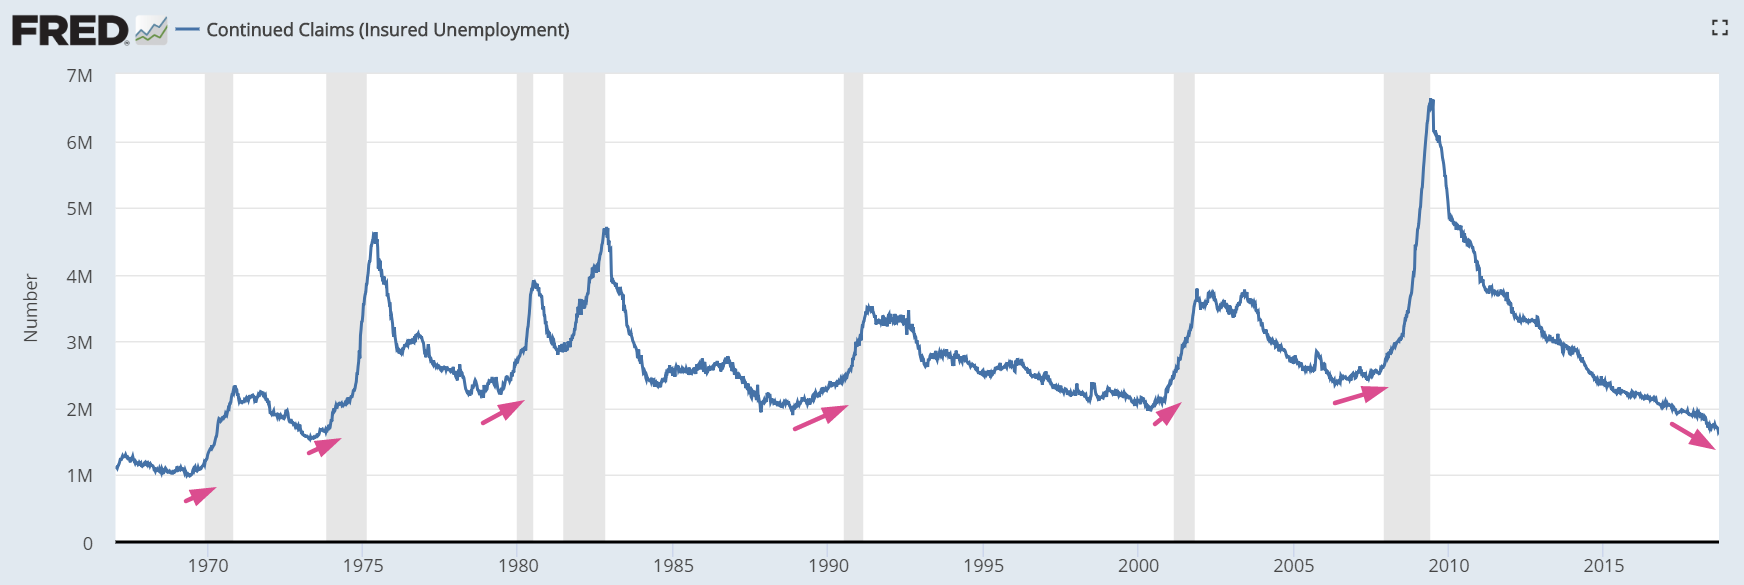
*Initial Jobless Claims and Continued Claims are very low right now (historically speaking). We are not concerned yet, but we are watching out for any sustained and significant increase in these 2 data series.
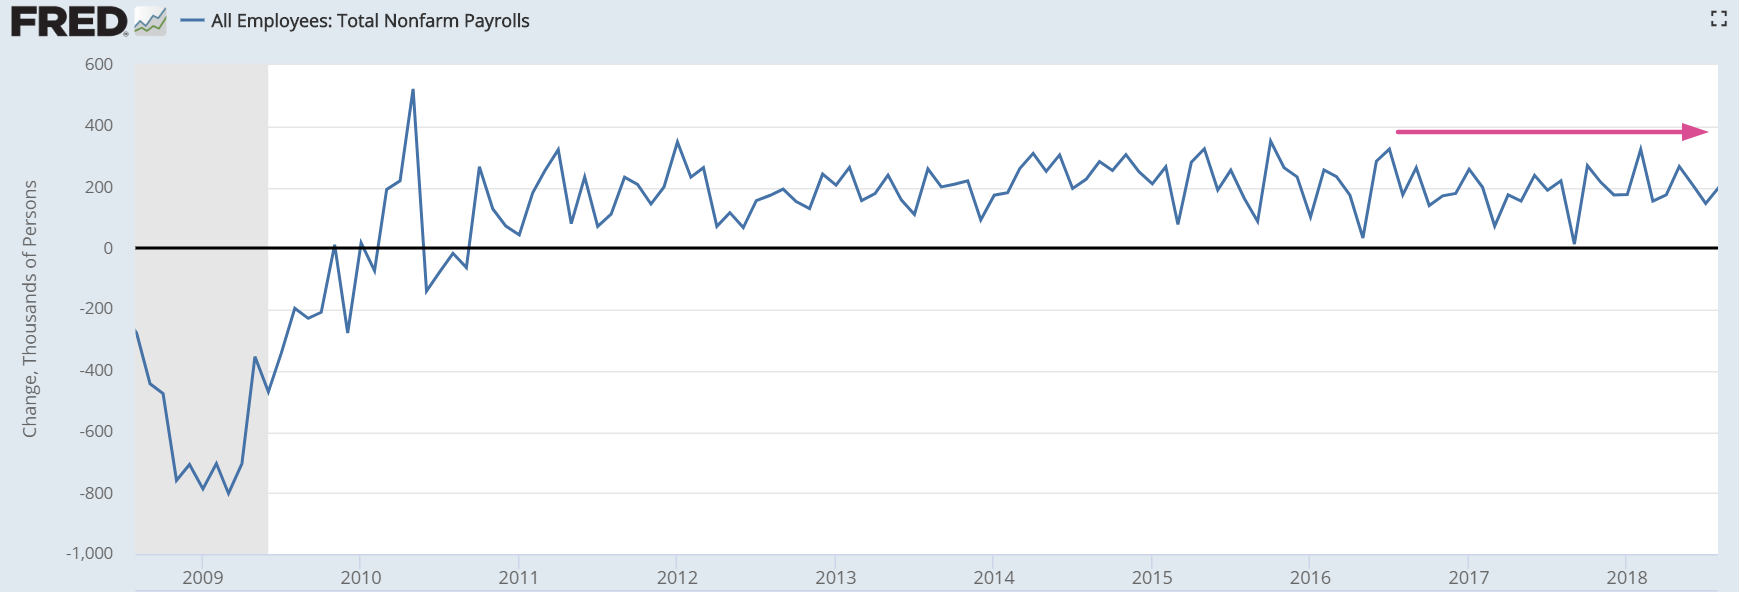
Nonfarm payrolls
Nonfarm payrolls growth has been trending sideways for the past few years. Nonfarm payrolls is not a leading indicator for the stock market or economy – it’s a coincident indicator. This indicator peaks when the stock market and economy peak.
Heavy Truck Sales
Even though Heavy Truck Sales dipped a little recently, the key point is that Heavy Truck Sales are still trending upwards.


Leave A Comment