
*These are my discretionary thoughts on the market. My Medium-Long Term model determines my trades.
The economy and stock market move in the same direction in the medium-long term. Hence, leading economic indicators are also leading indicators for the stock market.
Thoughts
1 am: The U.S. stock market is in a rare falling flag pattern. Here’s what this means for the stock market.
The U.S. stock market is in a rare falling flag pattern. Over the past 6 days, each day’s HIGH has been below the prior day’s HIGH and each day’s LOW has been below the prior day’s LOW.
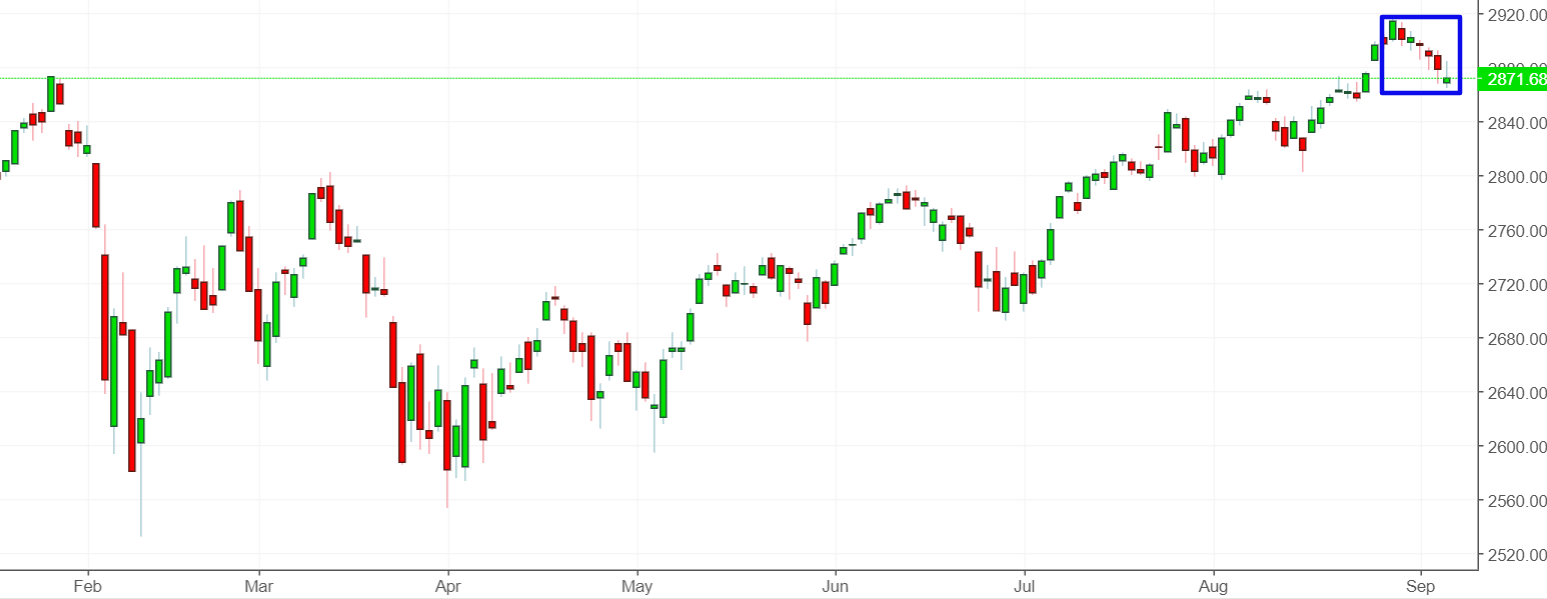
These falling flag patterns are rare because they represent very controlled selling. This has only happened 3 other times, and they were all in the 1950s. Here’s what the S&P did next.
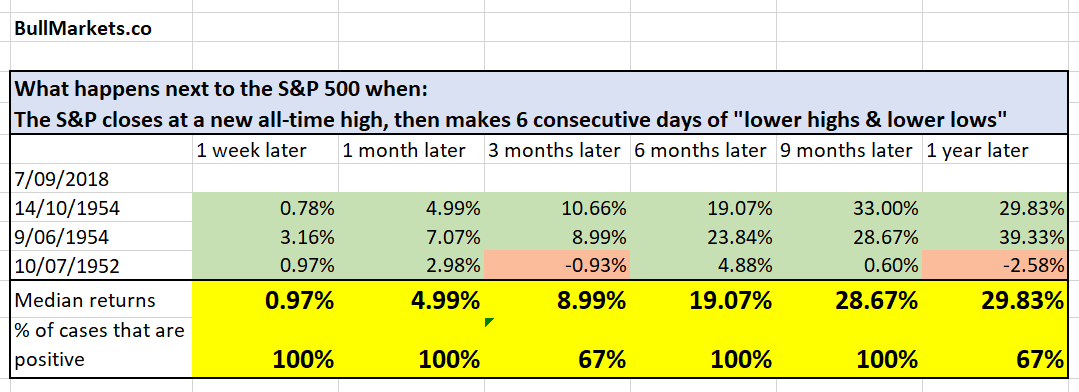
*Be mindful of extremely low sample size statistics. I wouldn’t put too much emphasize on this study.
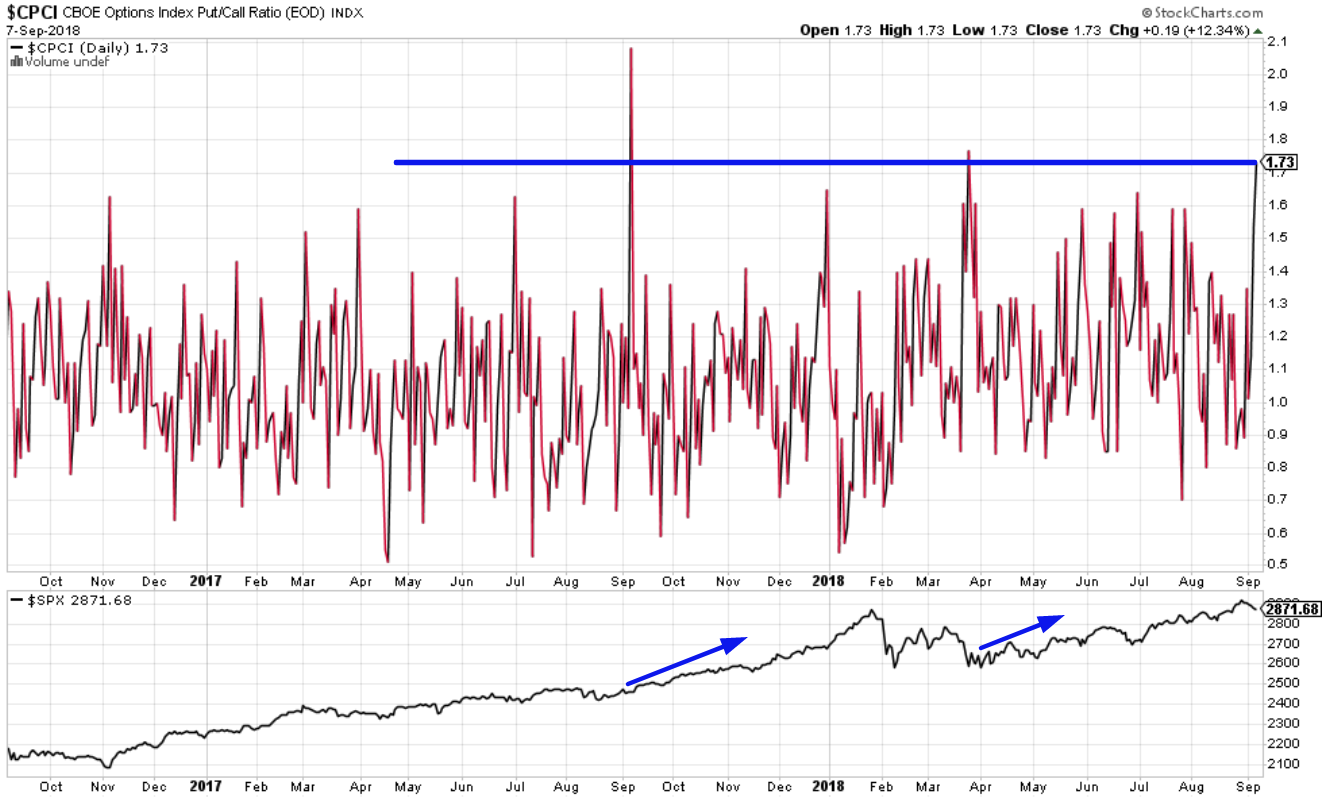
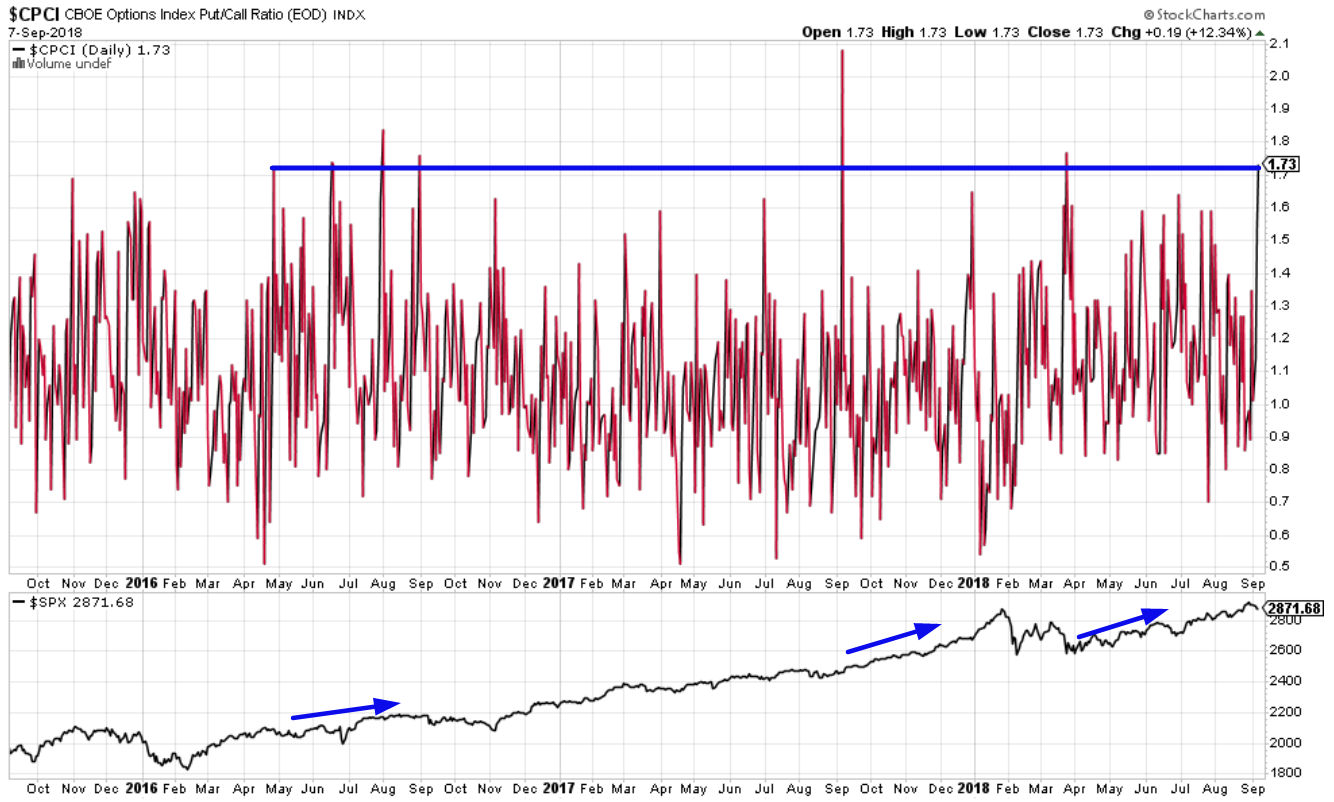
1 am: The options index Put/Call ratio spiked. Here’s what this means for the stock market.
The options index Put/Call ratio spiked last Friday. Over the past year, this spike has marked short term bottoms in the stock market.
1 am: The Fed is tapering very slowly to prevent a big decline in the financial markets
Every now and then there are these fears that the Fed’s tightening will kill the stock market.


Leave A Comment