
The Stock Market and Economic Data
In previous articles we have occasionally discussed the interaction between economic indicators and the stock market. Among the topics we have touched upon: for one thing, the capitalization-weighted indexes can hardly be called “leading indicators” of the economy anymore. In fact, if one studies specific major turning points over the past two decades or so, it is clear that the market seems to “know” very little (at least not in advance).

The impression one gets is actually that the major indexes are acting like coincident rather than leading indicators of the economy. However, the market is not completely bereft of leading indicator qualities. What seems to be leading the economy are not the cap-weighted indexes, but market internals.
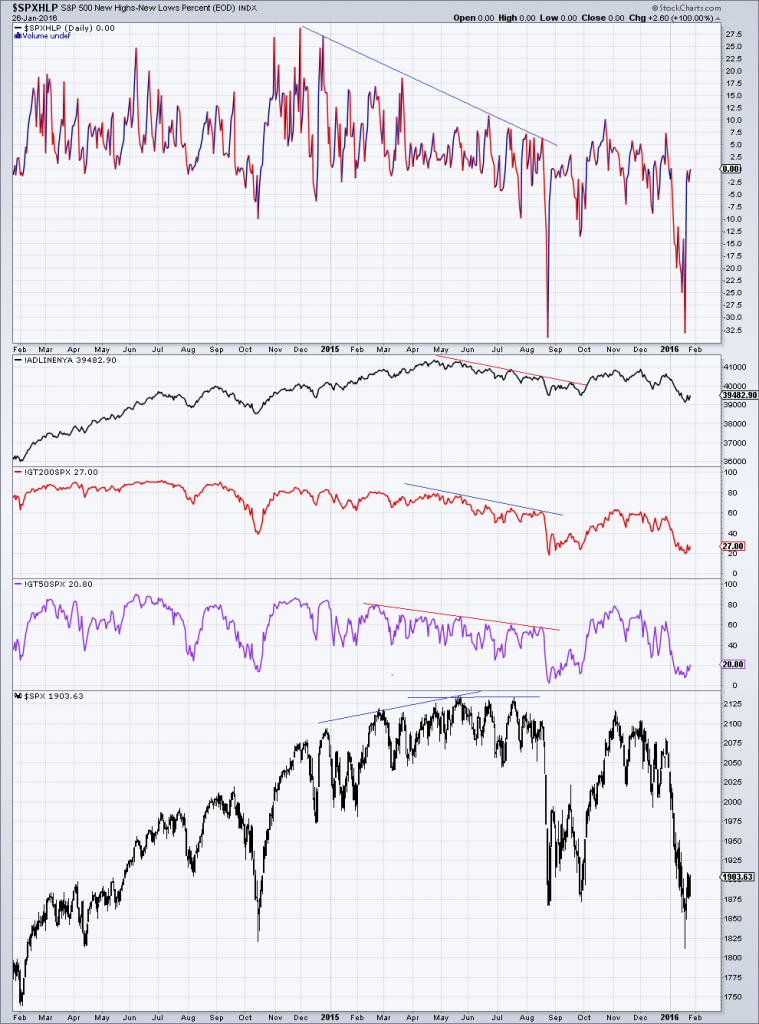
Even while the SPX still rose, resp. went sideways in 2015, market internals began to deteriorate (here shown: S&P hi/low percent, NYSE a/d line, SPX stocks above 200 & 50 day ma) – click to enlarge.
We believe we can explain why this is the case. In an economy in which the money supply can be expanded ex nihilo by central planners and/or commercial banks, the pace of money supply growth tends to lead both stock market returns and the performance of the economy as measured in terms of aggregate data.
Readers may have noticed our habit of adding the qualifier “as measured by aggregate data”. We are doing this because the boom period is a kind of Potemkin village: seemingly busy economic activity and surging accounting profits are masking the fact that a great deal of capital is consumed. Simply put, accounts are falsified, because loose monetary policy distorts and falsifies the entire economy’s price structure.
Due to the modus operandi of central banks and the growing popularity of all sorts of financial engineering strategies, financial asset prices are these days the greatest beneficiaries of monetary inflation. Once the pace of inflation begins to slow down, a difficulty presents itself that is first noticed in financial markets. The reduced flow of additional money means that parts of the bubble have to be abandoned – there is no longer enough “juice” to lift all the boats.
An internal shift takes place at that point: investors begin to sell less liquid stocks and move their funds into liquid big cap stocks, preferably those with a good “growth story”. We have seen yet another example of this behavior last year: already extremely overvalued big caps (i.e., the so-called “FANGs”) advanced strongly, while the vast majority of stocks came under varying degrees of pressure at the same time. The result was a sideways move in the popular indexes which superficially suggested that everything was fine, while large swathes of the market crumbled underneath the tranquility.


Leave A Comment