T2108 Status: 27.4%
T2107 Status: 27.6%
VIX Status: 19.6
General (Short-term) Trading Call: neutral – bullish bias
Active T2108 periods: Day #47 over 20% (overperiod), Day #1 under 30% (ending 45 days over 30%) (underperiod), Day #3 under 40%, Day #6 below 50%, Day #20 under 60%, Day #361 under 70%
Reference Charts (click for view of last 6 months from Stockcharts.com):
S&P 500 or SPY
SDS (ProShares UltraShort S&P500)
U.S. Dollar Index (volatility index)
EEM (iShares MSCI Emerging Markets)
VIX (volatility index)
VXX (iPath S&P 500 VIX Short-Term Futures ETN)
EWG (iShares MSCI Germany Index Fund)
CAT (Caterpillar).
IBB (iShares Nasdaq Biotechnology).
Commentary
After a brief stumble, the S&P 500 (SPY) sprinted higher from the open. Shortly after the U.S. oil inventory report, trading quickly changed. The index dropped straight down for over two hours.
Could be entering new phase of selling as both euro and yen gain favor: aka more carry trades closing. $EURUSD $USDJPY #forex $SPY
— Dr. Duru (@DrDuru) December 9, 2015
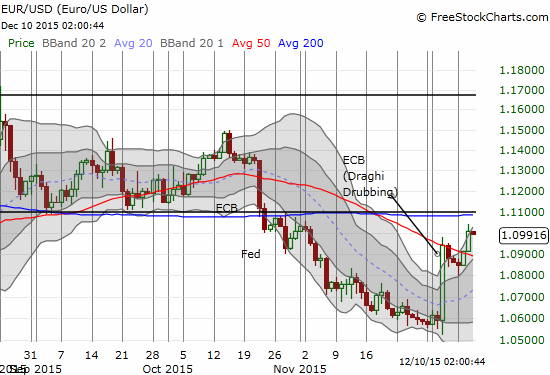
The currency markets caught my eye before stocks because of the synchronized gains in the euro (FXE) and the yen (FXY) which suggested a major “risk off” move was underway. It took longer than I expected, but the euro made a definitive continuation move from last week’s Draghi Drubbing. With EUR/USD at 1.10 I sold my fist full of FXE call options for a 33% gain.

The euro leaps above 50DMA resistance against the U.S. dollar
I am still overall bearish on the Japanese yen, especially against the U.S. dollar, so I used the dip in USD/JPY as an entry to my next trade. However, USD/JPY made an important break of support, so I am more wary than usual. The breakout from November is already over now.
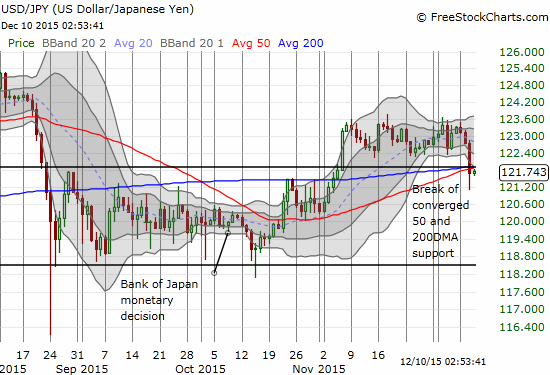
The Japanese yen pushes through converged support from the converged 50 and 200DMAs versus the U.S. dollar. This brings the breakout on Nov 6th to a quick end as no follow-through ever materialized.


Leave A Comment