
(T2108 measures the percentage of stocks trading above their respective 40-day moving averages [DMAs]. It helps to identify extremes in market sentiment that are likely to reverse. To learn more about it, see my T2108 Resource Page. You can follow real-time T2108 commentary on twitter using the #T2108 hashtag. T2108-related trades and other trades are occasionally posted on twitter using the #120trade hashtag. T2107 measures the percentage of stocks trading above their respective 200DMAs)
T2108 Status: 66.8%
T2107 Status: 59.3%
VIX Status: 13.6
General (Short-term) Trading Call: cautiously bearish
Active T2108 periods: Day #61 over 20%, Day #60 over 30%, Day #57 over 40%, Day #54 over 50%, Day #1 over 60% (overperiod), Day #6 under 70%
Commentary
The case for the buyers suddenly got a little stronger. The line in the sand they drew last week just got a little deeper.
T2108, the percentage of stocks trading above their respective 40-day moving averages (DMAs), closed at 66.8%, a mere stone’s throw from overbought status (above 70%). T2107, the percentage of stocks trading above their respective 200DMAs, jumped up to 59.3%. Together, these indicators helped confirm the bullish move of the S&P 500 (SPY) which gained 1.3% and confirmed 50DMA support.
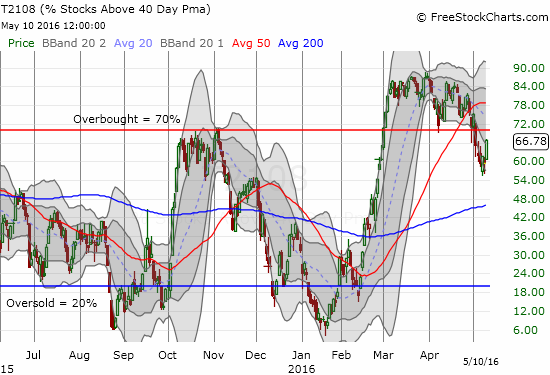
T2108 jumps back toward overbought territory
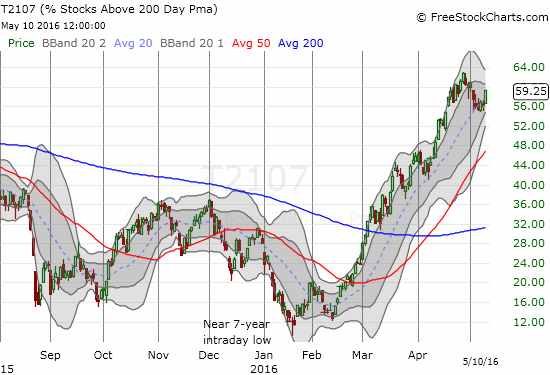
T2107 looks ready to re-establish its primary uptrend.
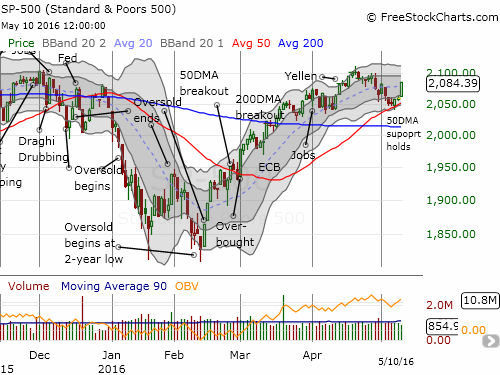
The S&P 500 (SPY) prints a solid gain that confirms the 50DMA as support.
The rally day delivered a strong 1.3% gain to the NASDAQ (QQQ). This third day of gains positioned the tech-heavy index for a test of MAJOR resistance converging at its 20, 50 AND 200DMAs. This is a critical test as a breakout would confirm a return of advantage to the buyers.
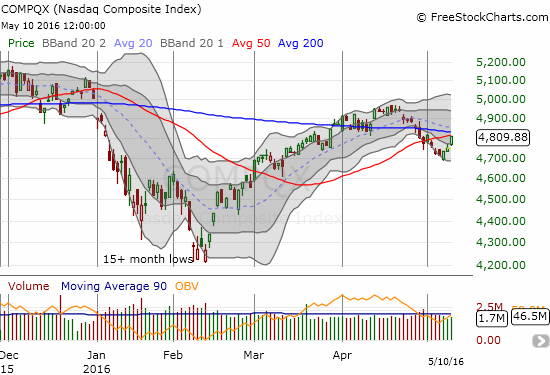
The Nasdaq (QQQ) is working on reversing a major technical breakdown.
The volatility index, the VIX, fell from the 15.35 pivot and closed just above recent lows. This move demonstrates the power of buyers but also puts the VIX back in an area from which it has tended to bounce.


Leave A Comment