The New Zealand dollar made more moves to the upside, but this reversed as the Federal Reserve became hawkish. What’s next? The milk auction is the next big thing. Here is an analysis of fundamentals and an updated technical analysis for NZD/USD.
New Zealand’s trade balance deficit widened to 285 million NZD, worse than expected. The publication took its toll on the kiwi, but the currency eventually recovered, also thanks to an upbeat measure of commodity prices, up 2% as well as better terms of trade, a rise of 5.7%. The US dollar enjoyed optimism about a March rate hike but suffered from the Donald Disillusion. Eventually, the Federal Reserve had the upper hand, and the greenback won over.
Updates:
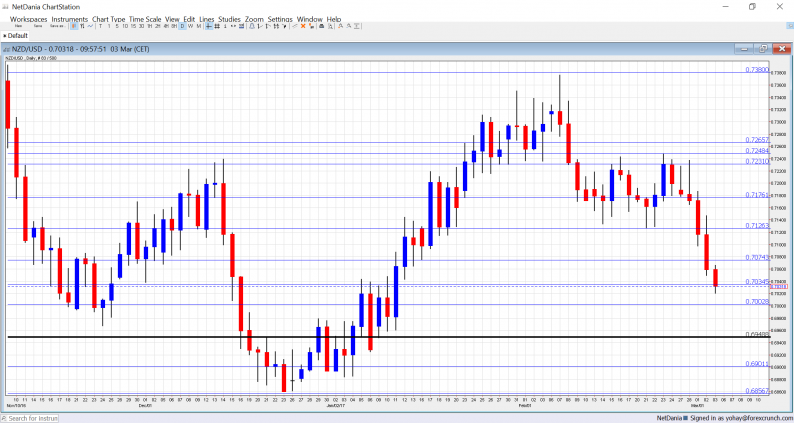
NZD/USD daily graph with support and resistance lines on it. Click to enlarge:

NZD/USD Technical Analysis
Kiwi/dollar dropped but bounced off the 0.7160 level (mentioned last week). It made a few moves to the upside but then collapsed, flirting with the 0.70 level.
Technical lines, from top to bottom:
0.7380 was the high recorded back in February and is our top line for now. Below, we find 0.7250, which capped the pair back twice in mid-February and serves as a double top.
0.7160, which capped the pair back in November is a pivotal line within the range. 0.7125 worked as a double bottom before it collapsed in early March.


Leave A Comment