T2108 Status: 65.7%
T2107 Status: 64.5%
VIX Status: 14.2
General (Short-term) Trading Call: cautiously bullish
Active T2108 periods: Day #76 over 20%, Day #75 over 30%, Day #72 over 40%, Day #6 over 50%, Day #5 over 60% (overperiod), Day #21 under 70% (underperiod)
Commentary
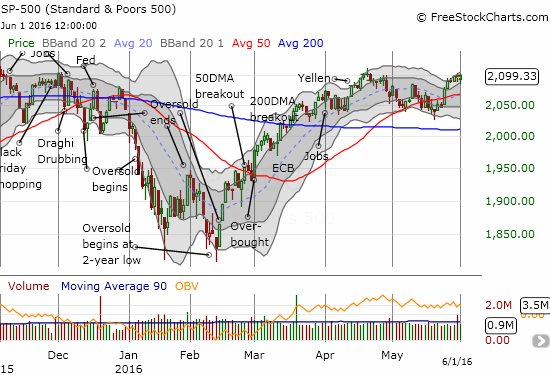
The general stock market is moving in slow motion. The S&P 500 (SPY) has closed just below the 2100 mark for three straight days.

The S&P 500 (SPY) is lumbering heavily just under 2100.
The NASDAQ (QQQ) has fared a little better although its jet-packed momentum from mid-May has slowed down a bit.
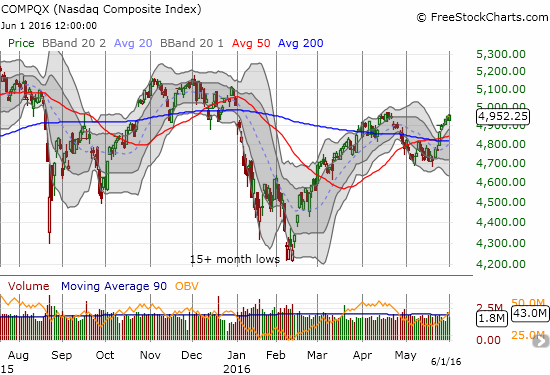
The NASDAQ (QQQ) has jumped nearly straight up for two weeks.
I suspect the market is generally waiting for the outcome of the May U.S. jobs report. This report comes out on Friday, June 3rd and could confirm a July rate hike from the Fed. I do not know how to map out the market’s potential reaction because the current rally started with the release of the minutes of the last Fed meeting. These minutes essentially confirmed that the Fed is itching and ready to raise interest rates again. If the market is truly getting comfortable with the prospect of an imminent rate hike, then a poor jobs report may actually be interpreted as bad.
The volatility index inched upward this week. The move is barely worth mention except to point out that the recent lows once again failed to maintain a grip on the VIX for long.
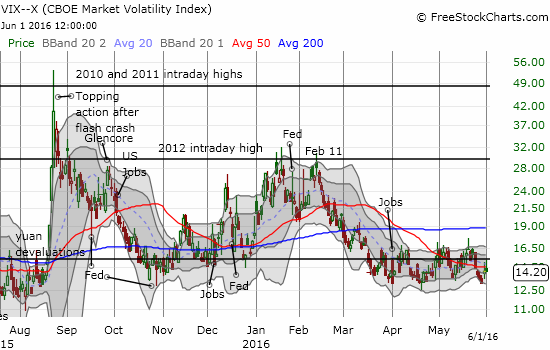
The volatility index is making very tentative efforts to lift off recent lows.
T2108 closed at 65.7%. It is inching ever more closely to overbought status. T2107, the percentage of stocks trading above their 200DMAs, hit a new 21-month high at 64.5%. T2107 is getting ever closer to a downtrend line that has held since 2009. While the new high is very bullish, I am still cautious because T2107 will need to break this multi-year downtrend in order to release the S&P 500 to new (all-time) heights.


Leave A Comment