(T2108 measures the percentage of stocks trading above their respective 40-day moving averages [DMAs]. It helps to identify extremes in market sentiment that are likely to reverse. To learn more about it, see my T2108 Resource Page. You can follow real-time T2108 commentary on twitter using the #T2108 hashtag. T2108-related trades and other trades are occasionally posted on twitter using the #120trade hashtag. T2107 measures the percentage of stocks trading above their respective 200DMAs)
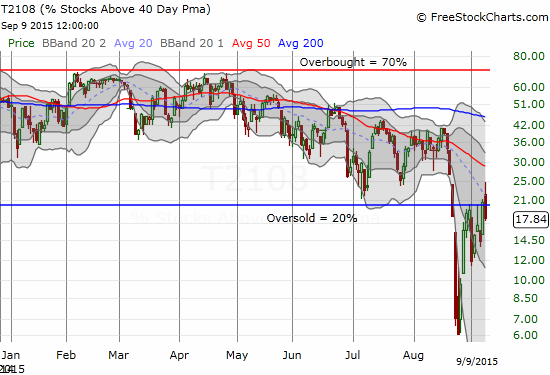
T2108 Status: 17.8% (Day #1 of a 2nd oversold period. Last one ended the day before.
T2107 Status: 21.4%
VIX Status: 26.2
General (Short-term) Trading Call: Bullish
Active T2108 periods: Day #1 under 20% (underperiod is oversold, last oversold period ended just a day before), Day #14 under 30%, Day #37 under 40%, Day #77 under 50%, Day #94 under 60%, Day #292 under 70%
Reference Charts (click for view of last 6 months from Stockcharts.com):
S&P 500 or SPY
SDS (ProShares UltraShort S&P500)
U.S. Dollar Index (volatility index)
EEM (iShares MSCI Emerging Markets)
VIX (volatility index)
VXX (iPath S&P 500 VIX Short-Term Futures ETN)
EWG (iShares MSCI Germany Index Fund)
CAT (Caterpillar).
Commentary
Here we go again.
Just one day after T2108 exited the first oversold period in almost a year, it drops right back into a second one with a close of 17.8. It looks like the battle royale between post-Labor Day bargain shoppers and anxious is officially underway.

T2108 started off promising with a small gap up and follow-through. Sellers pushed T2108 into a complete fade by the close.
The fade on T2108 was equally matched by the S&P 500 (SPY). The index was stopped cold right at its declining 20-day moving average (DMA) which happens to coincide with the high from the oversold period.
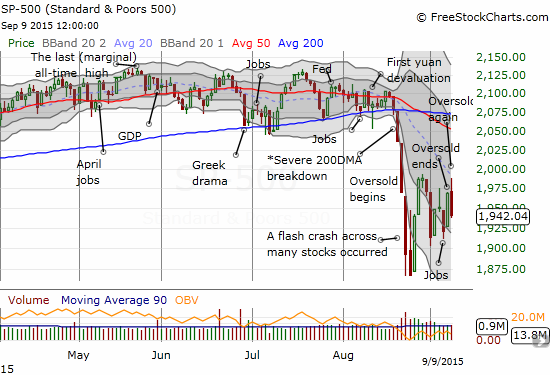
A wide chopping pattern is developing on the S&P 500
Essentially, the stock market has developed a nervous chop as it awaits the U.S. Federal Reserve’s policy decision in a week: Fedaggedon.


Leave A Comment