
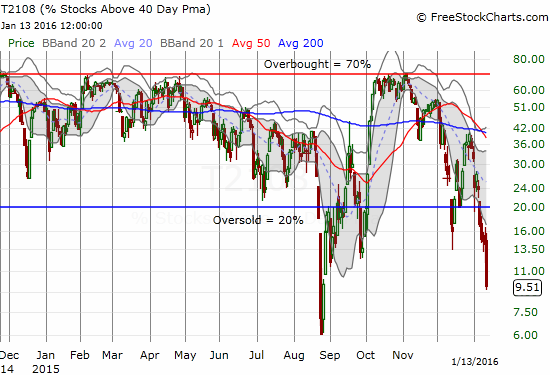
T2108 Status: 9.5% (5-month closing low)
T2107 Status: 17.2% (4 1/2 year closing low)
VIX Status: 25.2% (still below last week’s high)
General (Short-term) Trading Call: bullish
Active T2108 periods: Day #5 under 20%, Day #8 under 30%, Day #24 under 40%, Day #28 below 50%, Day #43 under 60%, Day #384 under 70%
Reference Charts (click for view of last 6 months from Stockcharts.com):
S&P 500 or SPY
SDS (ProShares UltraShort S&P500)
U.S. Dollar Index (volatility index)
EEM (iShares MSCI Emerging Markets)
VIX (volatility index)
VXX (iPath S&P 500 VIX Short-Term Futures ETN)
EWG (iShares MSCI Germany Index Fund)
CAT (Caterpillar).
IBB (iShares Nasdaq Biotechnology).
Commentary
T2108, the percentage of stocks trading above their respective 40-day moving averages (DMAs), sank to rare single-digit territory. At 9.5%, this oversold period joins just 15 other oversold periods since 1987 that have sent T2108 into single digits. (Recall that I define oversold as T2108 trading below 20%). Since 1987, the market has experienced 70 oversold periods. The last oversold period that included a T2108 dive into single digits was just last August/September. T2108 has not experienced a 1-2 punch like this since the 2008/2009 financial crisis.
Another way to look at the rarity of T2108 trading action is to count trading days. Of the 7311 trading days since 1987, 5.1% have suffered oversold trading. Of those 372 oversold trading days, 26.1% have suffered T2108 below 10%. The crash of 1987 produced the longest oversold period on record (I have data since late 1986). Excluding 1987, these numbers shift a bit to 4.7% of trading days spent in oversold territory and 19.0% of those oversold trading days below 10%. In other words, very roughly, for every five days that an oversold period drags on, one of those days features T2108 dropping into single digits. This is day #5 of the oversold period and day #1 under 10% – right on track! Unless the market makes an amazing comeback tomorrow (January 14, 2016), this oversold period could very well last 9 or 10 days before it ends with one more day of single digits for T2108.
T2108 is plunging fast and furiously in a redux of the kind of bear market action that hit the market last year.
Twenty-two oversold periods have lasted longer than this 5-day one. I mention this because the frequency and ferocity of these oversold periods since August further confirms that this market is suffering a major deterioration in its technicals. I am now worrying that a VERY long, extended oversold period is imminent before a sustained bottom occurs. Based on the chart below, “long” may be defined as 11 to 20 days. Only two oversold periods have lasted longer (in 1987 and 2008 – major crisis years!).


Leave A Comment