This week was remarkable, but you may not realize it by simply reviewing the major indices.
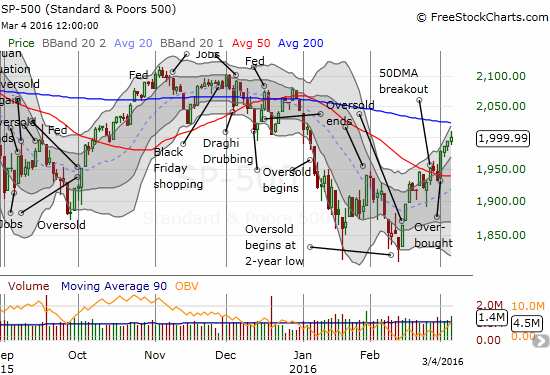
The S&P 500 (SPY) closed up 2.7% for the week, dominated by a 2.4% rally to start the month of March. This move was a convincing confirmation of a 50DMA breakout that ushered in the first overbought period in 414 trading days.

The S&P 500 has followed-through on its breakout with gains every day of this overbought period.
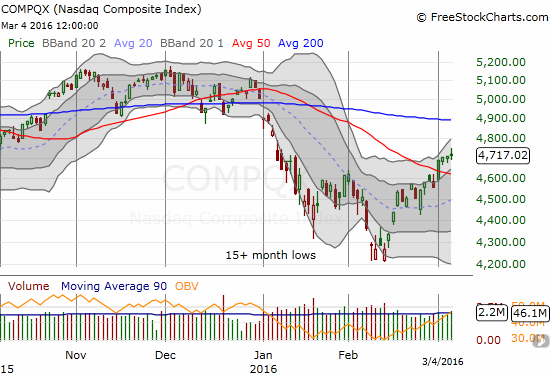
The NASDAQ’s follow-through has been more muted than the S&P 500’s
At 1999.99, the S&P 500 is still below declining 200DMA resistance. As the chart above shows, even the NASDAQ experienced a very moderate follow-through to its own 50DMA breakout. Traders have to turn to T2108, the percentage of stocks trading above their respective 40DMAs, and T2107, the percentage of stocks trading above their respective 200DMAs, to see the remarkable (relative) strength in the market.
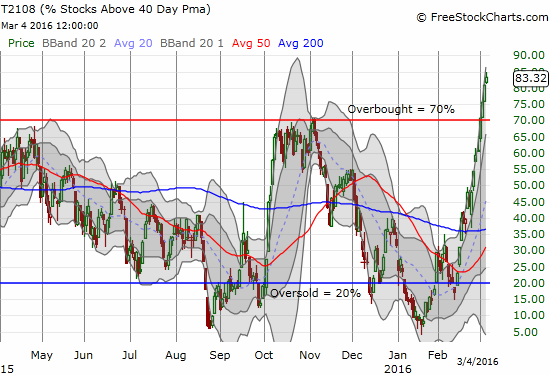
T2108 has raced upward in a near straight line since going oversold for the last time. At 83.3%, T2108 is at a level last seen in January, 2013.
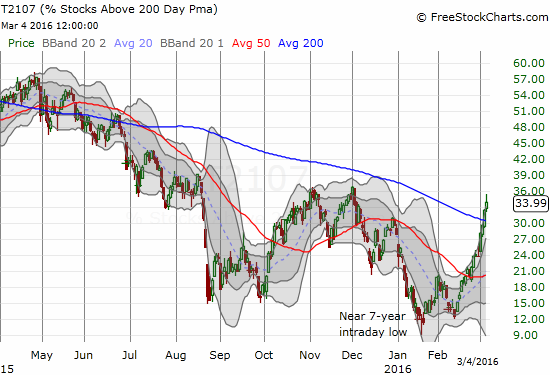
T2107 has also raced higher nearly non-stop and has now finally returned to recent highs.
T2108 and T2107 provide evidence of a rapidly healing market. This healing is not readily evident from the major indices. T2108 was last this high in January, 2013. T2108 is back to the highs seen after the recovery from the August angst. T2108 is so high that I am not expecting a lot further progress. I have only recorded THREE periods since 1986 where more than 90% of stocks traded above their respective 40DMAs: February to March, 1991, May to June, 2003, and April to May, 2009. Stock market historians will notice that these were the sharp recovery months following major market sell-offs. The last few stocks that have yet to recover above their 40DMAs are mainly the worst of the lot. I will give examples below of speculative stocks that have ripped higher for big gains. The stocks who could not gain on a week like this last one are simply not likely to gain much support later without a direct stock-specific catalyst.
I now move from T2108 to T2107. As long as T2107 can continue its advance, I will assume the market is still getting stronger. I have downgraded my trading call from bullish to cautiously bullish to reflect the dependence on a new dynamic. Moreover, the S&P 500 is now “close enough” to its 200DMA resistance to warrant even more caution than what I expressed when the index first began testing its 50DMA resistance; the index also finally showed more tentativeness by fading off Friday’s intraday high.
Overall, the trading rules I introduced in the first overbought period in 414 trading days remain. I will stay bullish until/if the S&P 500 closes below its 50DMA support AND follows through. Even a failure to break through 200DMA resistance will not cause me immediate alarm, especially if T2107 is advancing. Since there is little room between the 50 and 200DMAs, I do not feel an urgency to switch back to a bearish bias. The bearish alarms will go off if/once T2108 tumbles out of overbought status (below 70%).
The volatility index, the VIX, managed to print a marginal gain, but it remains in a definite downtrend. The VIX is on a path to return to the old 15.35 pivot.
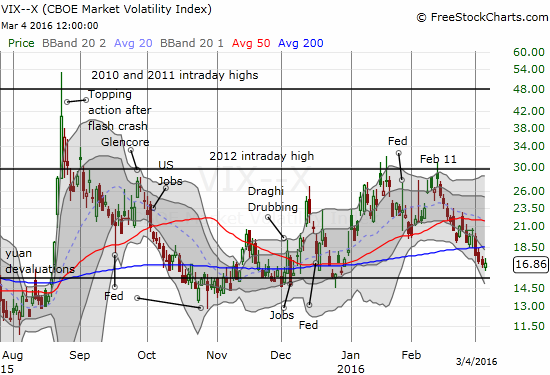
The volatility index, the VIX, continues its breakdown.
The Australian dollar (FXA) is fully supporting the bullish market sentiment. However, against the Japanese yen (FXY), the Aussie is getting very stretched. It has closed above its upper-Bollinger Band (BB) for four days straight and Friday’s close was well above the region that defines two standard deviations from the 20DMA. Resistance also looms overhead from the 200DMA.


Leave A Comment