
The good news is the NASDAQ composite (OTC) and the Russell 2000 (R2K) both hit all time highs last week. The market had another good week.
New highs increased, new lows remained insignificant, while the secondaries outperformed the blue chips and volume picked up.
The Negatives
The market is over bought. The major indices are up 2.5% – 4.5% in the past 2 weeks.
The first chart covers the past 6 months showing the OTC in blue and a 10% trend (19 day EMA) of NASDAQ new highs (OTC NH) in green. Dashed vertical lines have been drawn on the 1st trading day of each month.
OTC NH moved sharply upward last week, but was far from confirming the new index high.

The next chart is similar to the one above except it shows the S&P 500 (SPX) in red and NY NH, in green, has been calculated with NYSE data.
The pattern is similar to the chart above.

The Positives
The secondaries outperformed the blue chips and new lows remained at non threatening levels.
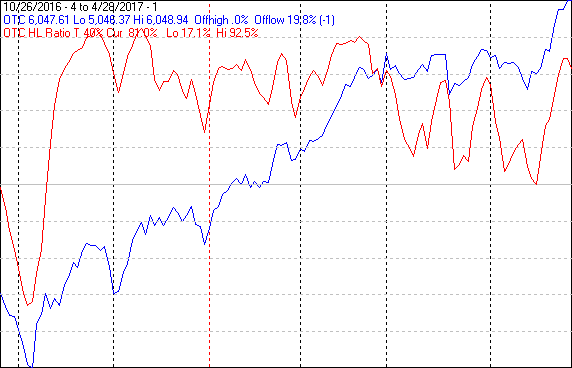
The next chart covers the past 6 months showing the OTC in blue and a 40% trend (4 day EMA) of NASDAQ new highs divided by new highs + new lows (OTC HL Ratio), in red. Dashed horizontal lines have been drawn at 10% levels for the indicator; the line is solid at the 50%, neutral, level.
OTC HL Ratio rose finishing the week at a very strong 81%.
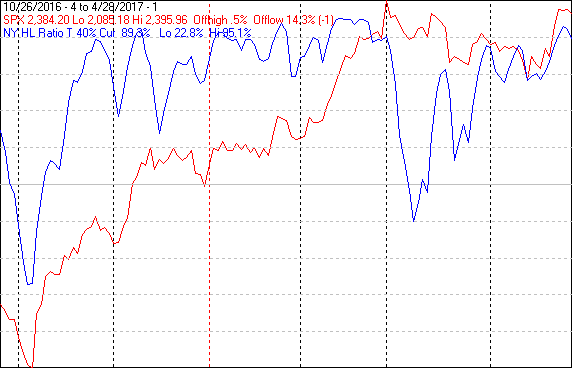
The next chart is similar to the one above one except it shows the SPX in red and NY HL Ratio, in blue, has been calculated from NYSE data.
NY HL Ratio rose to finish the week at a very strong 89%.
Seasonality
Next week includes the first 5 trading days of May during the 1st year of the Presidential Cycle. The tables below show the daily change, on a percentage basis for that period.
OTC data covers the period from 1963 to 2016 while SPX data runs from 1928 to 2016. There are summaries for both the 1st year of the Presidential Cycle and all years combined. Average returns for the coming week have been much stronger during the 1st year of the Presidential Cycle than average of all years.


Leave A Comment