In this past weekend’s newsletter, I discussed the formation of a very important “head and shoulders” topping pattern in the market.
I know…I know. As soon as I wrote that I could almost hear the cries of the “perma-bull” crowd exclaiming “how many times have we heard that before.”
They would be right. The problem with the majority of technical analysis, in my opinion, is that time frames are too short for most investors. When looking at technical price patterns using daily data, there have been numerous occasions where analysts have spotted “Head and Shoulder” patterns, “Hindenberg Omens,” and “Puppy Monkey Baby“ patterns that have failed to predict a market downturn.
Of course, like “crying wolf,” when these patterns and prognostications fail they are summarily dismissed as being wrong, or just “mumbo jumbo.” As I stated above, the problem is the “duration mismatch” between most technical analysis, which is typically very short-term (minute, hourly, daily), and the outlook for investors which is in years.
As a portfolio manager, what is important for me is the understand the longer-term “TREND” of market prices. By looking at weekly and monthly data, the trend of prices is revealed allowing for a better match between portfolio goals and related market risks.
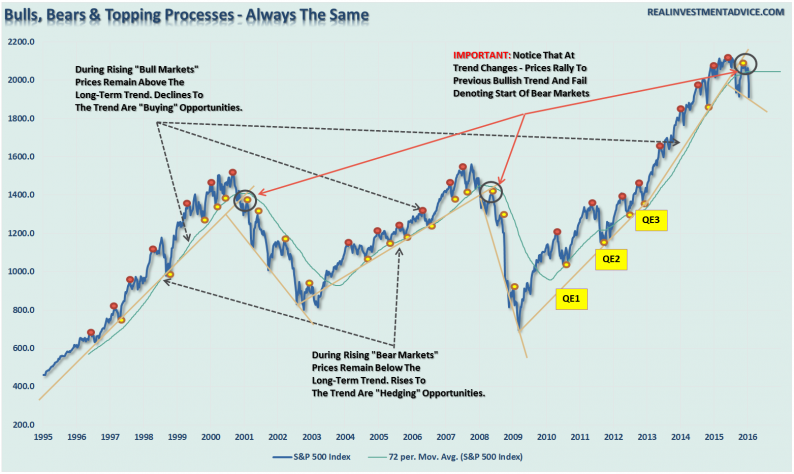
During “bull markets,” prices are in a steady advance with corrections to the longer-term bullish trend presenting buying opportunities. When prices become extended from the trend, such deviations provide opportunities to take profits and rebalance portfolios.
Conversely, during “bear markets,” prices are in a steady decline with corrections to the longer-term bearish trend presenting selling, hedging and shorting opportunities. When prices become extended away from the bearish trend, such deviations should be used to take profits in short positions and portfolio hedges.
This idea is shown in the chart below.
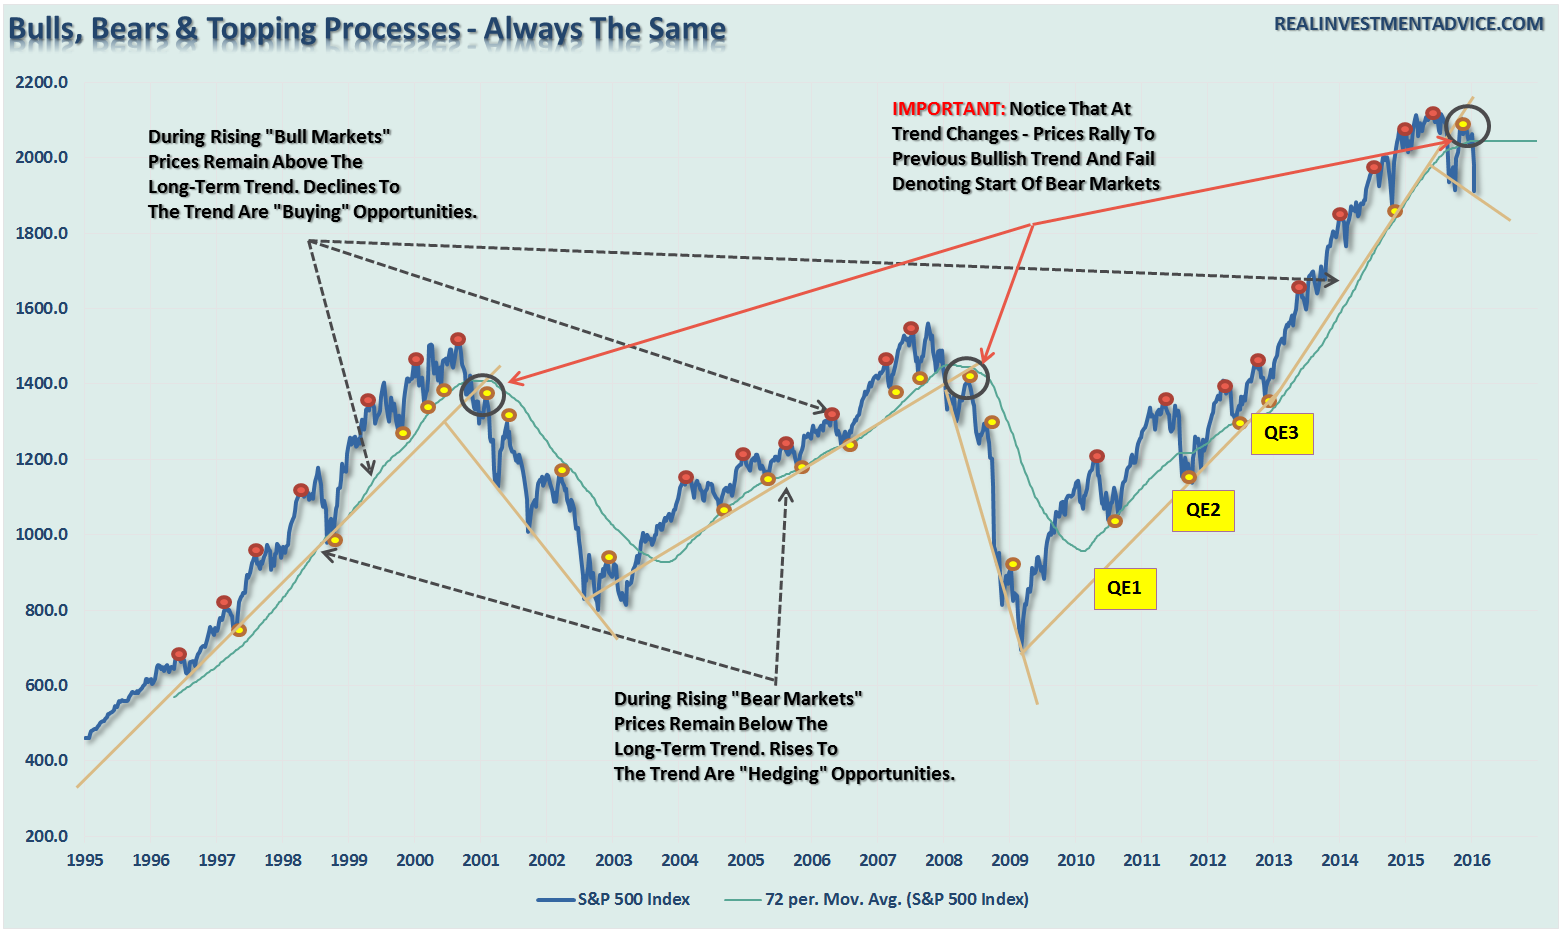
By using a 72-month (6-year) moving average, the longer-term trend of prices is more clearly revealed. As stated, corrections to the longer-term trend during bull markets were buying opportunities, whereas during bear markets they were selling/shorting opportunities.
VERY IMPORTANTLY – note that at the peak of the previous two markets the change from the bullish to bearish trend was denoted by the following price action:


Leave A Comment