

In our portfolio management practice, we focus on weekly and monthly data to smooth out daily volatility. Since we are longer-term investors, our focus remains on being invested during rising (bullish) trends and more heavily weighted to fixed income and cash during declining (bearish) trends. Therefore, the only data that really matters to us is where the market closes at the end of each week.
As I stated in this past weekend’s missive:
“While the immediate consensus is the ‘bear market of 2018’ is now over, there are several important points about the chart below that should be considered.
- Despite the correction, the market did hold support at the 200-dma
- The bullish trend line, which goes back to the beginning of 2016, has also not been violated.
- However, the upper red “trendline” may provide some overhead resistance temporarily and is worth watching closely.
- While the market did get oversold on a short-term basis, which suggested a bounce was likely, the longer-term overbought condition, and subsequent ‘sell signal’ remain intact.
The bottom line is that while there was much ‘angst’ in the markets last week, the market has not violated any important trend lines that would suggest the current sell-off is anything more than just an ordinary ‘garden variety’ correction.”
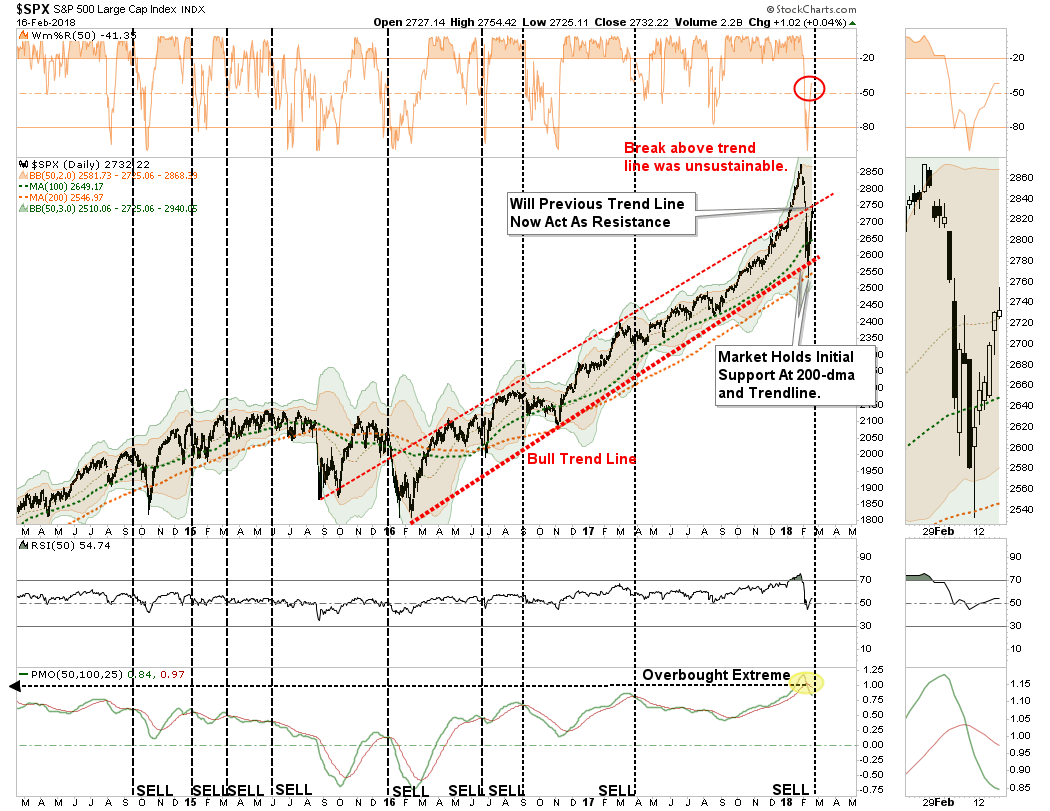
This morning, the market opened back below the 50-dma.
While this is concerning, and keeps our short-hedge in place for now, it is where we finish this trading week that will determine out next positioning changes. The chart below is a weekly view of the S&P 500 index. With much of the volatility stripped away, the important levels for the close of trading on Friday become more evident.
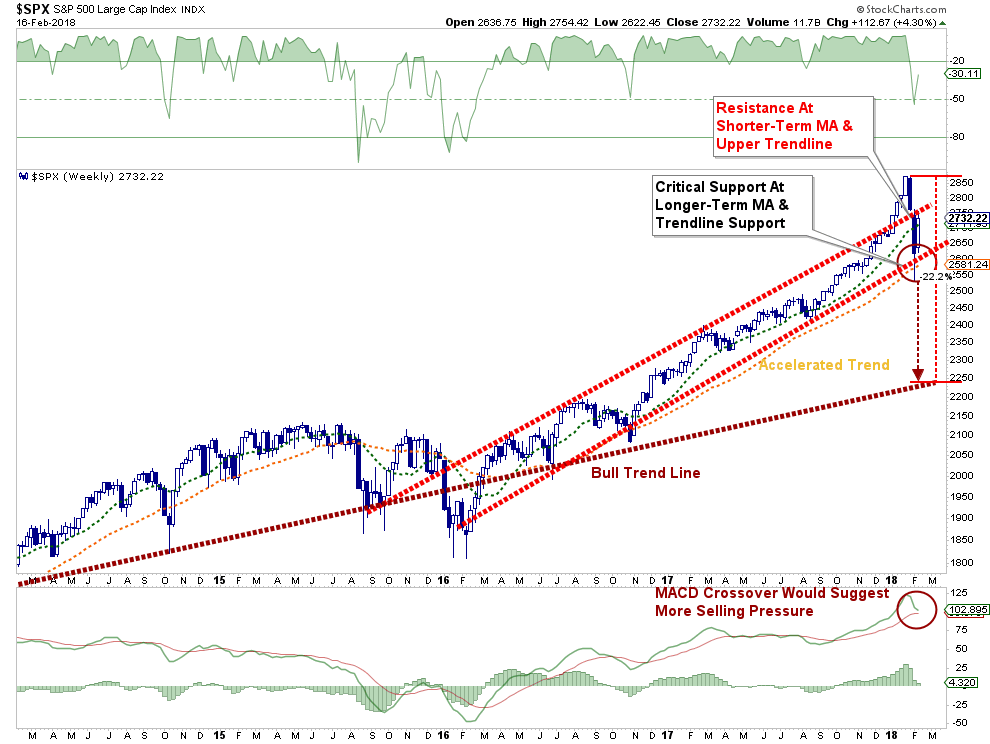
In order for us to fully remove hedges, the market must close above the 50-dma on Friday.
As noted, there is tremendous resistance from the upper trendline of the bullish trend channel that began at the beginning of 2016. We currently expect the market to remain confined to the currently rising bullish trend channel, but there are risks to that view which keeps us cautious.
A failure at resistance which leads to a retracement back to recent lows and the 200-dma is very likely. Here is what we are looking for if that happens.


Leave A Comment