
Given the markets were closed on Monday, the analysis from this past weekend’s missive did not change. The important takeaway from that analysis was:
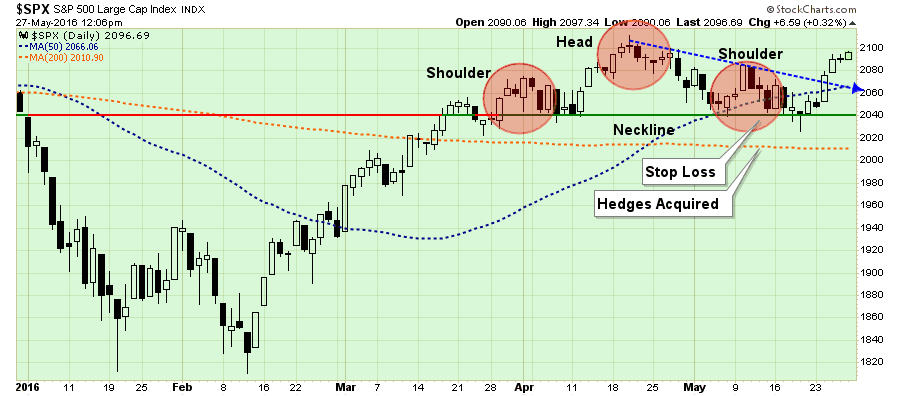
“A couple of week’s ago I discussed the rather clear “head and shoulders” technical pattern that we developing in the market. These patterns often suggest deeper corrections if they complete by breaking neckline support. A “gray rhino”if there ever was one.
The good news is the rally this past week terminated that formation by breaking the very short-term downtrend line as shown below.”
“While the market did nullify the more bearish short-term pattern, it is important to note that the market has not done much more than that.
All that really happened last week, as shown in the chart below was an oversold bounce on deteriorating volume confined to an overall market downtrend.”
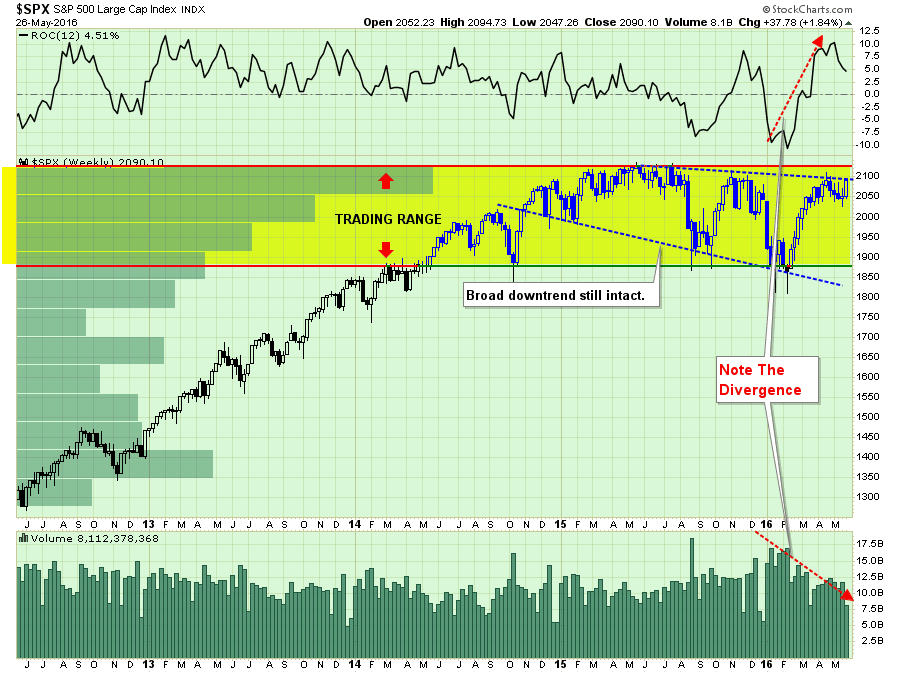
“This isn’t a rally that should embolden investors to take on more risk, but rather considering “selling into it” as we head into the seasonally weak period of the year.
But that’s just me.
One note though. The markets have not made a new high within the past year. What does history suggest happens next? 77% of the time it has evolved into a bear market.
On second thought, maybe that should be you too.”
If this “bull market” is going to have legs, it is imperative the markets break above 2100 this week and make a push toward all-time highs. A failure to do so will likely suggest a pull-back to recent support at 2040 as shown in the chart above.
Importantly, a break below 2040 will signal the onset of a broader summer correction that could very well see a retest of the lows of the trading range that began in 2014.
In other words, the risk/reward ratio is not ideal for investors as we head into the seasonally weak period of the year.


Leave A Comment