

In this past weekend’s missive, I went dove into the current backdrop of the markets, bullish exuberance, interest rates and oil prices. Of particular note was the current bifurcation of the market as shown in the sector rotation chart below.
“The problem with the breadth of the advance is significant. As shown in the sector rotation chart, the current rally has been extremely bifurcated. Such extreme deviations in performance tend not to last long and tend to have rather nasty reversions.”
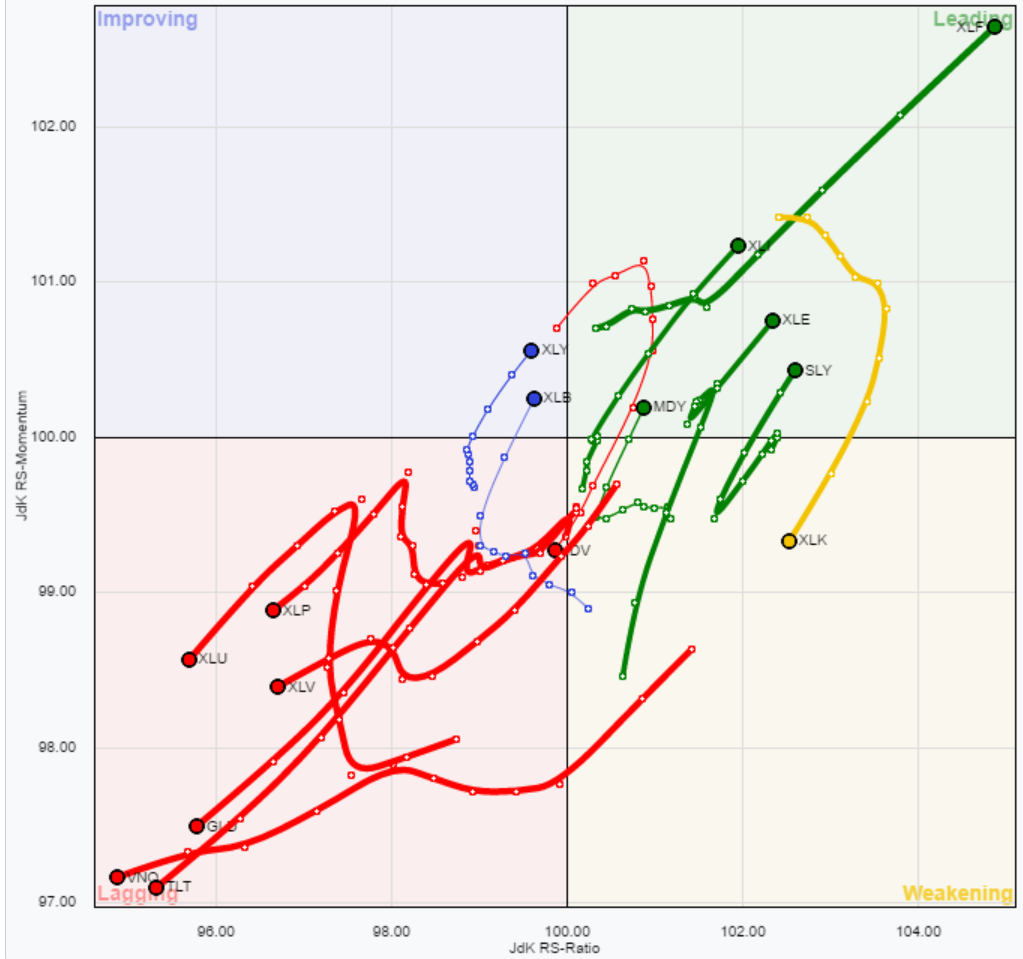
The importance of understanding the nature of reversions is critical for investors. Markets rarely move in one direction for very long, notwithstanding overall trends, without a correction process along the way. While the chart below shows this clearly for the overall market, it applies to individual sectors of the market as well.
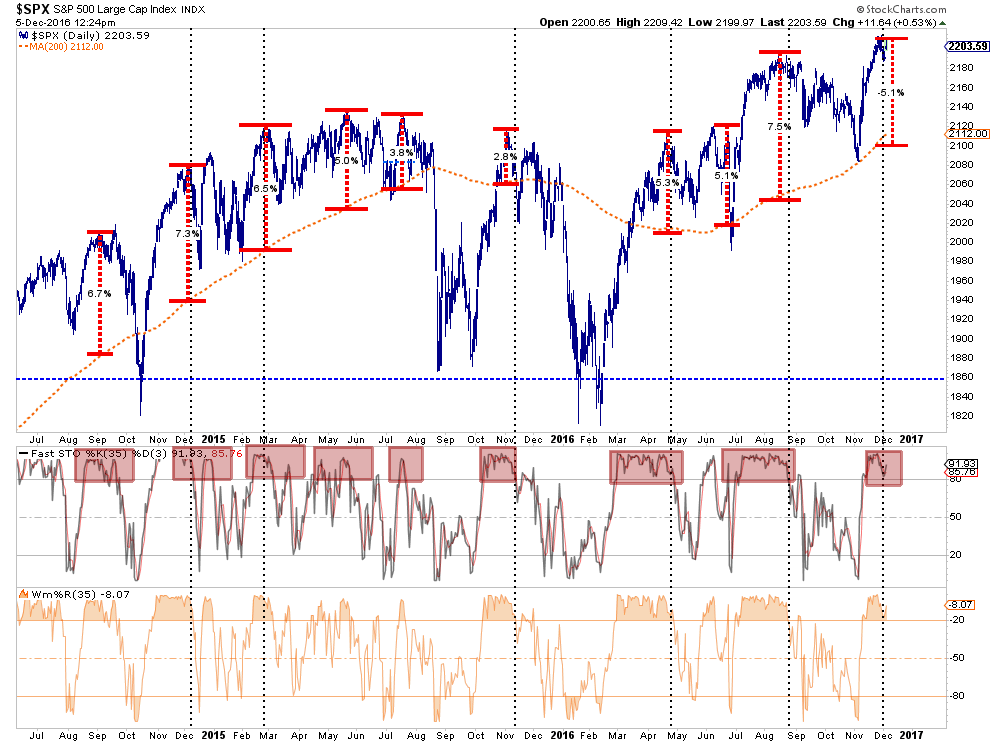
Importantly, notice the bottom two part of the chart above. When there is a simultaneous culmination of overbought conditions combined with a more extreme deviation, corrections usually occur back to the underlying trend.
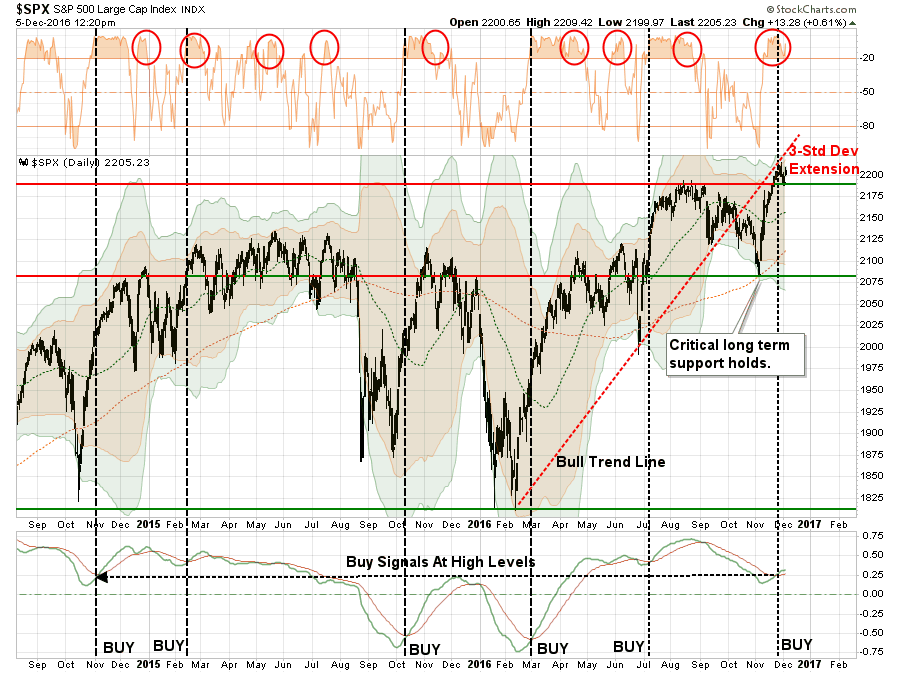
This can also be seen in the next chart as well. While the “Trump Rally” has pushed asset prices higher and triggered a corresponding “buy signal,” that signal has been triggered at very high levels combined with a very overbought condition. Historically, rallies following such a combination have not been extremely fruitful.
Stepping back for just a moment, while the markets continue to ignore the risks of “Brexit”, “Trumponomics,” “Italexit,”rising interest rates, a stronger dollar and valuations in the short-term, history suggests the consequences of excessive risk-taking have not been resolved.
As shown in the very long-term chart below (back to 1925), the markets are pushing long-term overbought conditions, combined with high valuation levels, that have historically yielded low-return outcomes.


Leave A Comment