
A comment today after the close caught my eye:
I don’t normally look at monthly candles, but I decided to peek……..
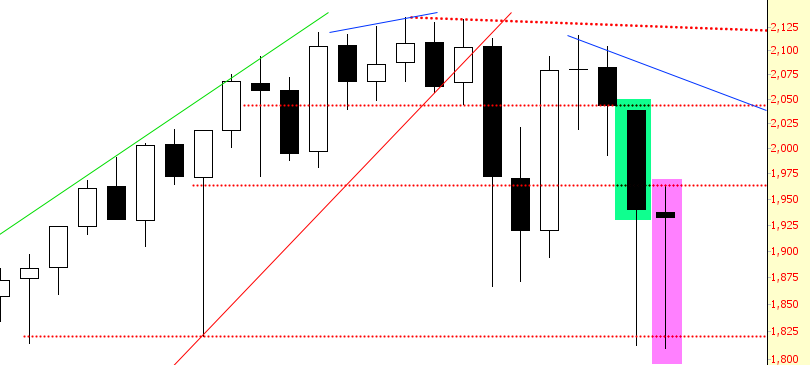
So we can see January’s lovely drop (green tint) followed by February’s maddening, lame-o, close-near-the-highs candle (which spanned a huge range).
I looked on the S&P 500 cash for a similar instance, and I found one……..
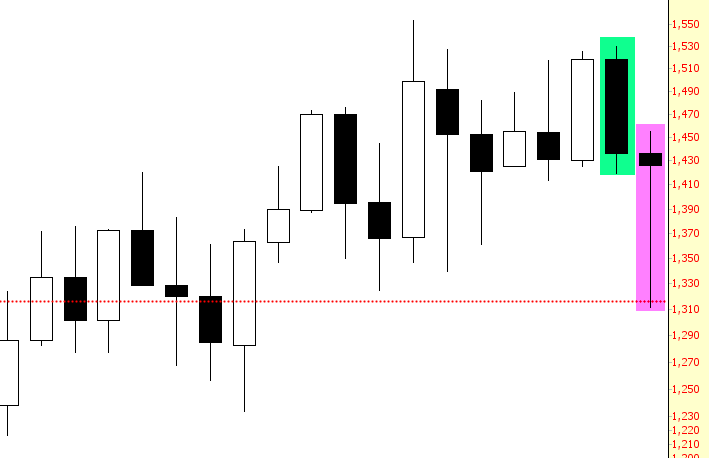
Which, umm, preceded this (take note of the first two bars on the left side of this chart; those are the green/magenta pair):
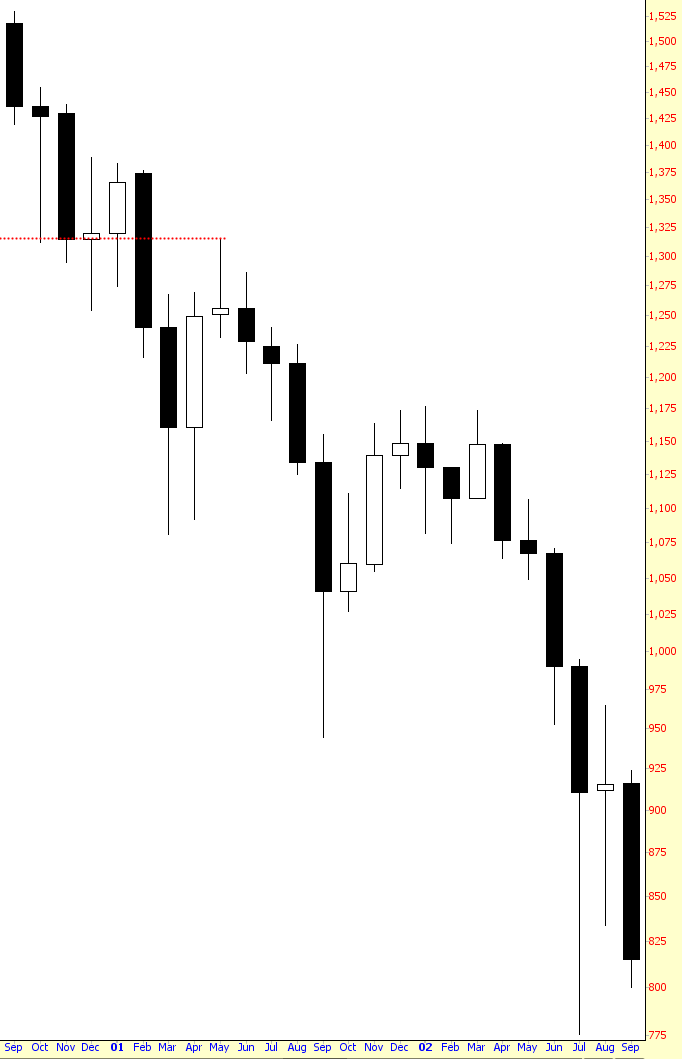
Anyway, just give me a down March, OK? It’s really not that much to task.


Leave A Comment