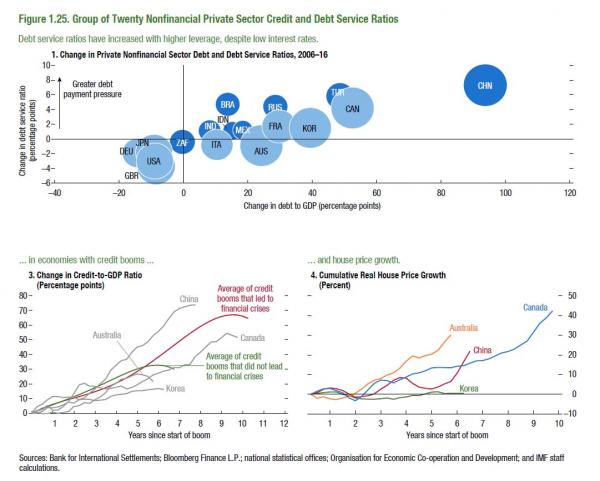
That China is a widely accepted global outlier in the context of credit, debt and leverage, look no further than the latest Financial Stability Report from the IMF, which in no uncertain terms lays out where China can be “found” relative to its G-20 peers in the following chart:

Yet according to the IMF, China’s bleak picture is based on a relatively rosy estimate of the country’s non-financial debt to GDP at approximately “only” 242%.
The reality, however, is that China’s true leverage picture is far worse, and while there are far more aggressive and pessimistic estimates in the public domain, we have chosen the latest number calculated by Victor Shih from the Mercator Institute for China Studies, who in a just released report calculates that total non-financial credit in China stood around 254 trillion RMB as of May 2017, equivalent to 328% of 2016 nominal GDP, or nearly 100% higher than the official IMF estimate. This is also 34% increase as a share of GDP compared with the end of 2015.
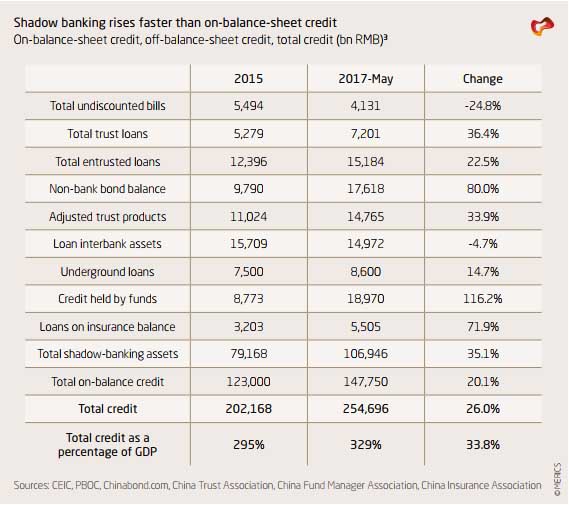
And while some categories of shadow finance, including bill finance and non-loan trust credit, have actually declined in recent months (duly noted here), most other categories rose by double digits in percentage terms in the year and half between the end of 2015 and May 2017. Of note, credit held by funds, rose by 116%.
So with credit soaring, Shih – like Goldman clients – asks “how much longer can this go on?” and answers that “the amount of interest that debtors in China must pay creditors provides clues on the costs of such a high debt level. If interest servicing exceeds incremental increase in nominal GDP, the debtor would need to pursue one of two courses of action to avoid a crisis. This ultimately goes to the question whether China has hit its “Minsky Moment” or is still in the Ponzi Finance stage, a discussion popularized by Morgan Stanley first in 2014.
Here are Shih’s observations:
First, creditors can extend even more credit to the debtors so that interest payments are serviced with new credit. This mechanism renders China more of a Ponzi unit, which requires new credit to service interest payments. Alternatively, a rising share of income for households, firms, or government will go toward servicing interest. While the first dynamic would cause the acceleration of debt accumulation, the second dynamic is tantamount to a massive tax which will slow growth for an extended period.
The problem with both approaches is that China as a whole is a Ponzi unit. And, as Shih calculates and as shown in the chart below, total interest payments from June of 2016 to June of 2017 exceeded incremental increase in nominal GDP by roughly 8 trillion RMB (Figure 1).
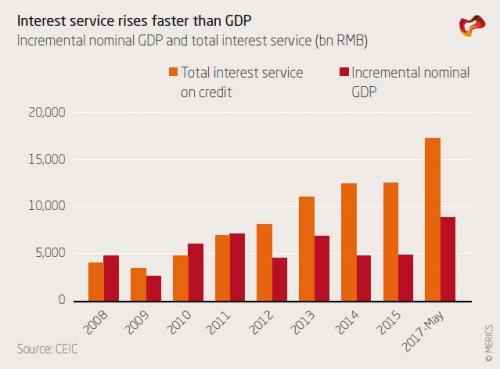
And since we have not see large-scale defaults in China, the new additional interest burden must have been financed in some way. Most likely, the Merics analysis notes, roughly this amount or more was capitalized as new loans, contributing to the rapid rise in total debt. As the chart above shows, this was not always the case. Prior to 2011, incremental nominal GDP roughly matched or even exceeded interest payments. The advent of high-yielding shadow banking led to the explosive growth in interest payments, and thus the need to capitalize interest payments, starting in 2012. This is a dynamic which will drive debt growth in China for years to come, or until the debt bubble ends.
So what ends the bubble? According to the Merics analysis, there are 4 possible channels for a financial crisis in China. First, it should be noted that despite the enormous debt load, a domestically triggered crisis is not likely in the next five years. Trouble is more likely to come from some combination of capital flight and sudden withdrawal of external credit.
With that in mind, the crisis scenarios are as follows:
Below we present the full details on each scenario, courtesy of Shih’s analysis:
HOUSEHOLD SECTOR CRASH
The financial malaise that the United States experienced in recent years stemmed from household sector indebtedness, which led to distrust between financial institutions over distressed household debt they held on their balance sheets. Is this a possible scenario for China? Because Chinese household debt is still a relatively small share of GDP and of banking sector assets, the sudden appearance of a large amount of distressed household debt by itself will not impact the financial system significantly. However, because the appearance of distressed household debt likely will correlate with a serious economic downturn, this will feed into debt deflation triggered by the highly-indebted corporate sector.
We calculate household debt by adding the PBOC official statistics of other depository institutions’ claims on the household sector to loans made by housing providence funds (HPF), which are non-bank entities, to households. To be sure, a pattern of rapid leveraging is apparent. While household savings growth has fallen to under 10%, recent months have seen household borrowing exploding at 30% growth rates. Household debt has reached 41 trillion RMB as of the end of June 2017, which included 36.7 trillion in bank loans and over 4 trillion in housing providence loans. Because of the high speed of growth, Chinese household debt has reached nearly 60% of GDP by June 2017 (Figure 2). It is poised to reach over 90% of GDP by 2020, essentially pre-crisis level in the United States.

Yet, Figure 2 also reveals that even if we assumed that household debt will grow by 25% in the years leading up to 2020, it will remain a modest 20% of overall bank assets because overall banking sector assets also will rise quickly. Thus, even 25% NPL ratio for household debt would only require a write-down of roughly 5% of bank assets. If this were to occur in isolation (a big if), a combination of government bailout and bank write-down likely will resolve the problem with little difficulty. It is likely that households also borrowed additional amounts to pay down payments in recent years. From 2013 to the end of 2016, buyers in China paid approximately 13 trillion RMB in down payments. If a quarter of that was borrowed, household debt would increase by another 3.25 trillion, again a relatively modest amount in China’s banking system.


Leave A Comment