
Please note: All data, figures & data are valid as of March 12th. All trading carries risk. Only risk capital you can afford to lose.
Traditional Markets
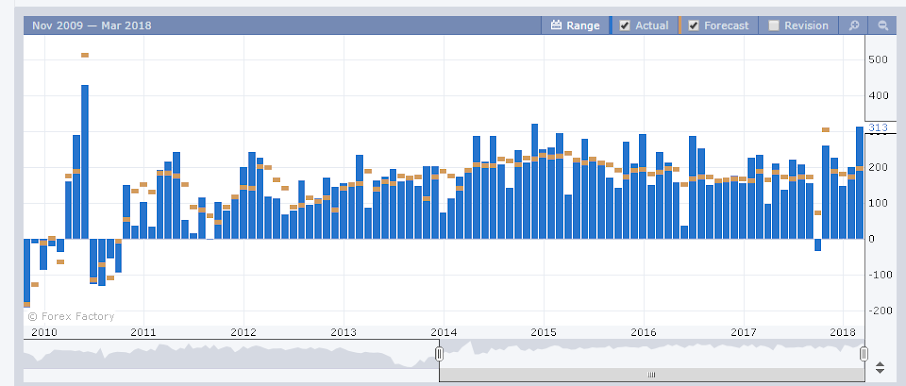
Everyone was expecting a strong jobs report on Friday, but the actual numbers that came out were extraordinary. The markets flew!!
The expectation was for a bit more than 200,000 jobs added in February, but the actual data showed 313,000 jobs, the highest reading since December of 2014. Not bad for a short month.
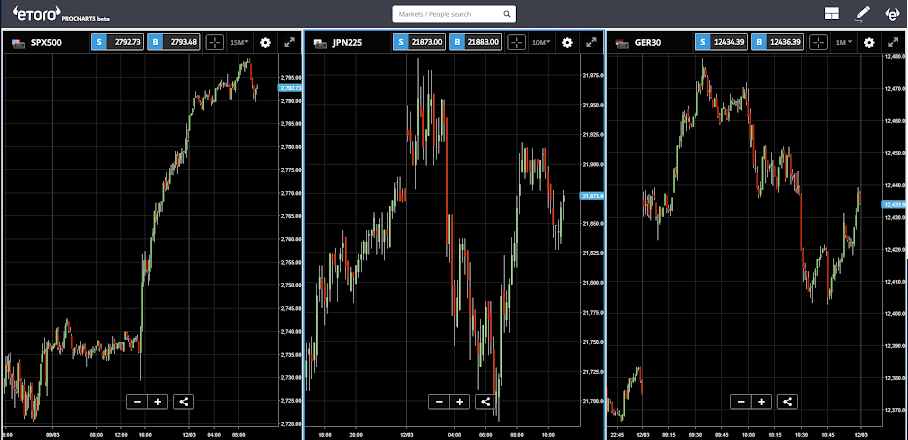
Stocks in New York took off at the open and ended up closing with gains of about 1.75%. Though markets in Asia and Europe opened up after the weekend with some sizable gaps up, they do seem to be having trouble carrying the momentum.
Today is a bit light on data releases, though there will be a 10-year bond auction during the US session, the focus is already starting to shift to the inflation data that’s coming out of the States tomorrow morning.
Divergence Forming
As we mentioned above, the market is full of relationships. One relationship that usually remains quite tight is the USDJPY and the US 10 Year Bond Yields.
We’ve been focusing quite heavily on the 10 Year Yield lately since it was able to give an early indication of the market rout that we saw in early February.
As we can see on the chart below, the USDJPY and the 10 Year tend to mimic each other’s movements, but somehow they’ve decoupled at the beginning of 2018.
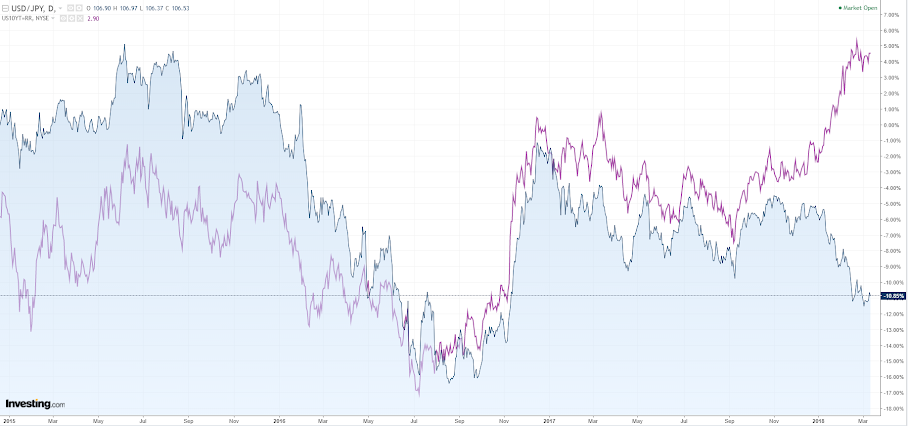
This situation is particularly uncomfortable for US stocks traders and for the Bank of Japan, both of whom would prefer these respective lines to be a bit flatter at the moment.
Crypto Divergence
As we saw in the opening letter above, Wall Street is starting to watch Bitcoin as an indicator, so let’s give em a good show.
The aforementioned Wall Street Journal article showed the following chart….
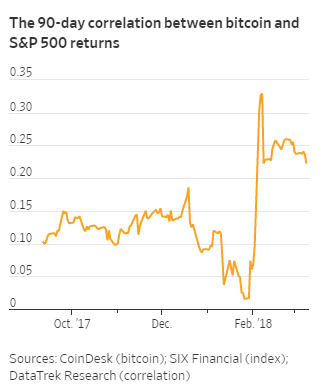
From what we can see, in the short term Bitcoin and the stock indexes don’t line up much, except for a ten-day period at the beginning of February when they both fell hard together.


Leave A Comment