
Official recession calls are the responsibility of the NBER Business Cycle Dating Committee, which is understandably vague about the specific indicators on which they base their decisions. This committee statement is about as close as they get to identifying their method.
There is, however, a general belief that there are four big indicators that the committee weighs heavily in their cycle identification process. They are:
The Latest Indicator Data
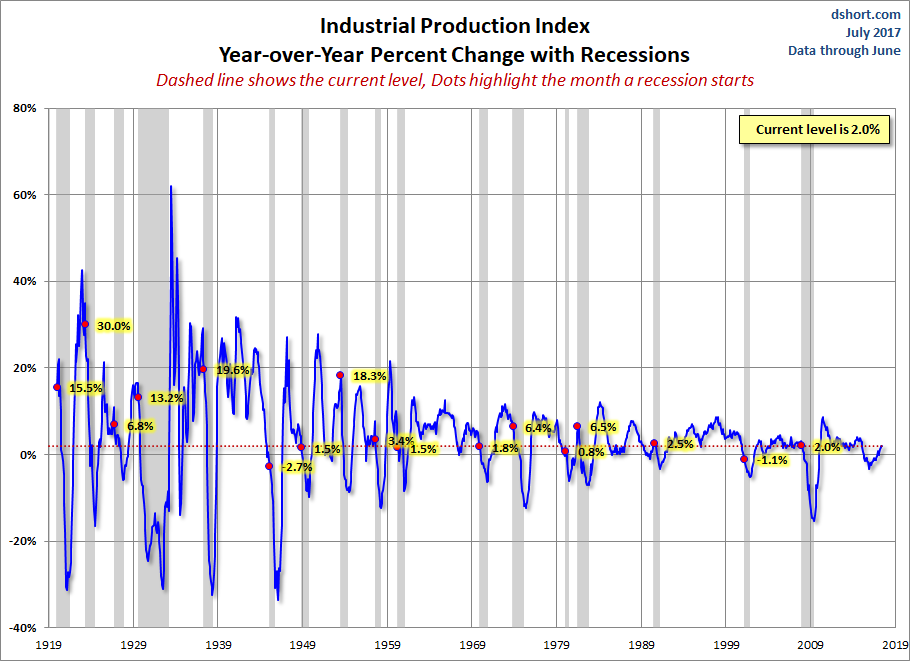
Today’s report on Industrial Production for June shows a 0.4% increase month-over-month, which was above the Investing.com consensus of 0.3%. Industrial Production peaked in November 2014, only one point higher than its pre-recession peak in November 2007. The year-over-year change is 1.97 percent, up from last month’s YoY increase.
Here is the overview from the Federal Reserve:
Industrial production rose 0.4 percent in June for its fifth consecutive monthly increase. Manufacturing output moved up 0.2 percent; although factory output has gone up and down in recent months, its level in June was little different from February. The index for mining posted a gain of 1.6 percent in June, just slightly below its pace in May. The index for utilities, however, remained unchanged. For the second quarter as a whole, industrial production advanced at an annual rate of 4.7 percent, primarily as a result of strong increases for mining and utilities. Manufacturing output rose at an annual rate of 1.4 percent, a slightly slower increase than in the first quarter. At 105.2 percent of its 2012 average, total industrial production in June was 2.0 percent above its year-earlier level. Capacity utilization for the industrial sector increased 0.2 percentage point in June to 76.6 percent, a rate that is 3.3 percentage points below its long-run (1972–2016) average. [view full report]
The chart below shows the year-over-year percent change in Industrial Production since the series inception in 1919, the current level is lower than at the onset of 10 of the 17 recessions over this time frame of nearly a century.
Capacity Utilization
The Fed’s monthly Industrial Production estimate is accompanied by another closely watched indicator, Capacity Utilization, which is the percentage of US total production capacity being used (available resources includes manufacturing, mining, and electric and gas utilities). In addition to showing cycles of economic growth and demand, Capacity Utilization also serves as a leading indicator of inflation.


Leave A Comment