
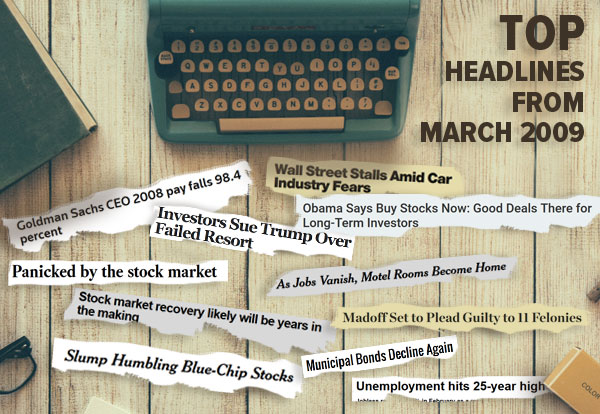
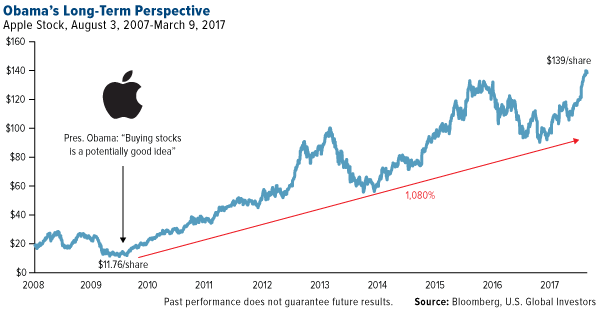
Eight years ago last week, President Barack Obama gave investors a surprisingly hot trading tip. In office less than two months, he commented that we were at “the point where buying stocks is a potentially good deal if you’ve got a long-term perspective.”
Obama couldn’t have known then how accurate his call was. The market found a bottom that very week, and investors who took the president’s advice managed to get in on the absolute ground floor.
At the time, investor sentiment was at or near record lows. The number of S&P 500 Index stocks trading below $10 a share had grown tenfold since the end of 2007. The New York Stock Exchange, in fact, had to temporarily suspend its requirement that equities trade at more than $1 a share. Giant companies such as Citigroup and General Motors—a share of which cost little more than a pocketful of spare change—were at risk of being delisted.
Today, many of those bullish investors have seen some spectacular gains. Since its low of 666 in March 2009, the S&P 500 has climbed a whopping 260 percent, with not a single year of losses. The average annual return has been over 15.7 percent, based on Bloomberg data. With dividends reinvested, it’s closer to 18 percent.
Just take a look at Apple, which has surged more than 1,080 percent as it introduced or expanded its line of got-to-have, now-ubiquitous products, from the iPhone to iPad.
To show you just how far we’ve come, I put together a few comparisons of several indices and economic factors between March 2009 and now.


Leave A Comment