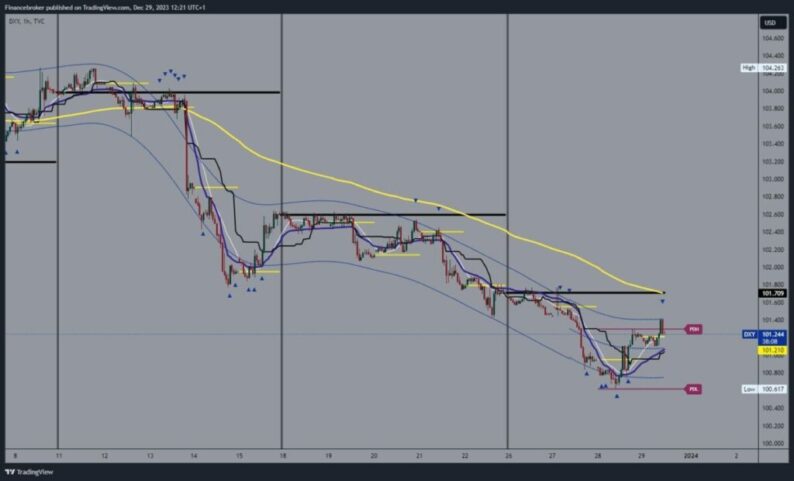
Dollar index chart analysisThe dollar index continued its previous bearish trend this week. Yesterday, we saw the formation of a new low at the 100.61 level. We were able to find support and trigger a recovery to 101.40 levels during the Asian session. We stop at the 101.40 level and make a minor pullback to the 101.20 level.In order to continue on the bullish side, we need to stay in this zone now in order to start a further recovery with the next impulse. Potential higher targets are 101.60 and 101.80 levels. In the zone around 101.60, we come across the EMA50 moving average, which could present additional resistance on the bullish path. 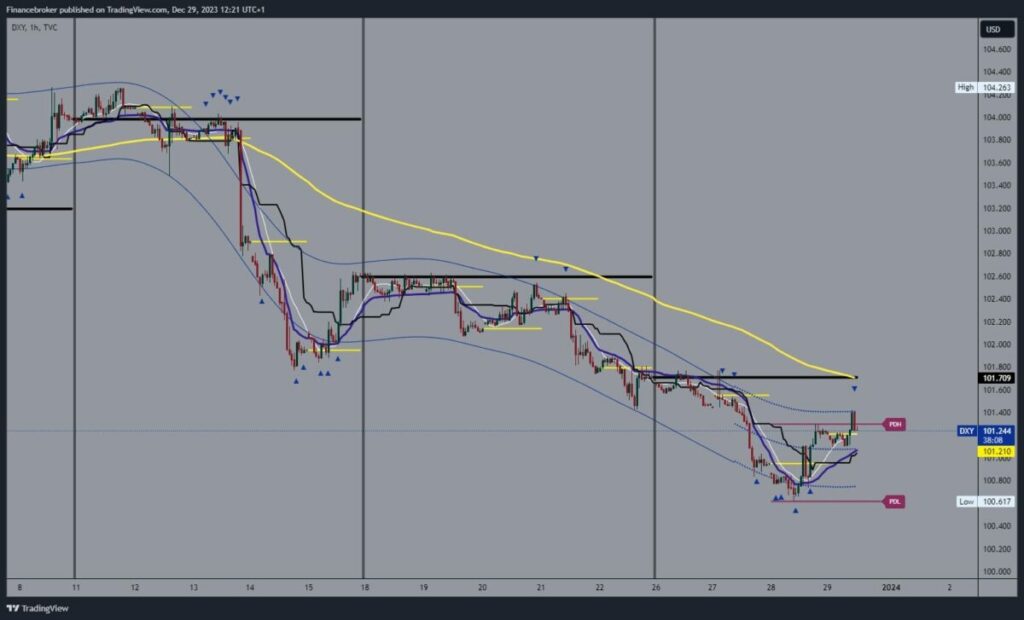 Could the dollar continue a further pullback below 100.50?We would have to first check below the 101.00 level for a bearish option. Thus, we would form a new daily low, leading to a new increase in pressure on the dollar. After that, we expect to see a test of the previous low and the formation of a new one. Potential lower targets are 100.40 and 100.20 levels.Naderna Sunday is the first of the new year, and we will start with stronger economic news only from the second of January. On Tuesday, the Reserve Bank of Australia will release its future interest rate forecast, and later in the day, we have the US Manufacturing PMI for December. Wednesday: ISM Manufacturing PMI, ISM Manufacturing Prices, JOLTs Job Openings (Nov) and FOMC Meeting Minutes. On Thursday, we highlight German CPI, ADP Nonfarm Employment, Initial Jobless Claims for the previous week and US Services PMI. Finally, on Friday: Eurozone CPI, US NFP and Unemployment reports.More By This Author:Promising Altcoins For 2024: The Digital Currency Revolution
Crypto Boom 2024: Predicting The Next Big Boom In Currencies
APM Stock: Is It Worth Investing In APM?


Leave A Comment