Every few weeks I look forward to the jobs report that comes out the first Friday of every month. It’s not because I particularly like this report. It’s because the markets pay so much attention to it. Though I find it odd they typically only look at how many jobs were added, not the quality.
But that’s how you have to trade in today’s markets. You’ve got to know what the investment community is looking at, and how it responds. It’s a tireless job. Besides employment, other economic reports come out every day, and the markets have a different way of responding to each one. GDP, housing, consumer pricing – there’s a lot to look out for.
There’s been a lot of anxiety surrounding the housing market in particular since it crashed and dragged the global economy down with it 10 years ago. And Harry hasn’t been its biggest fan amidst talk of the “housing recovery,” because like many things in our artificial, Fed-driven economy, it’s been questionable.
So let’s take a look at where we were before the financial crisis of 2008/2009 and the top of the housing bubble in 2006/2007 to give us some context for where we are today.
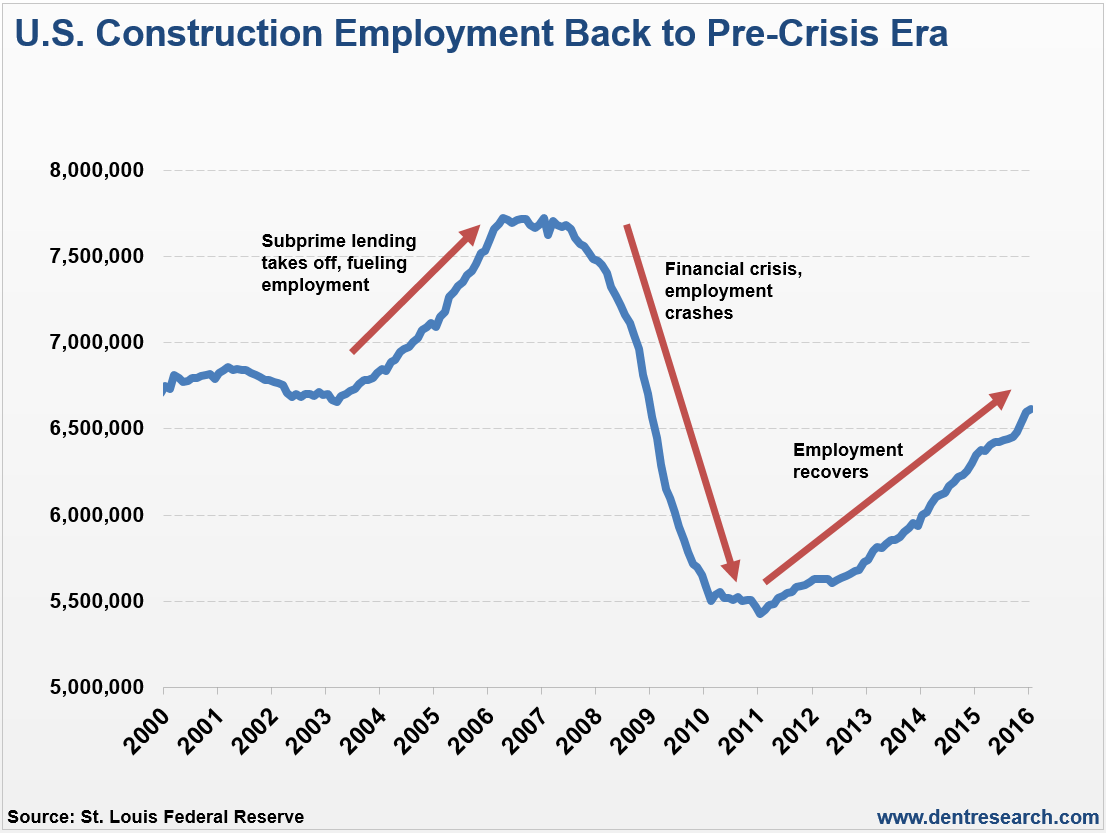
First, look at the chart below showing construction jobs before and after the crisis:

Construction jobs have grown steadily since bottoming out in 2010/2011. You can see how this sector really bubbled up during the era of subprime lending that led to the crisis. Today, employment’s back to where it was before the bubble really got crazy.
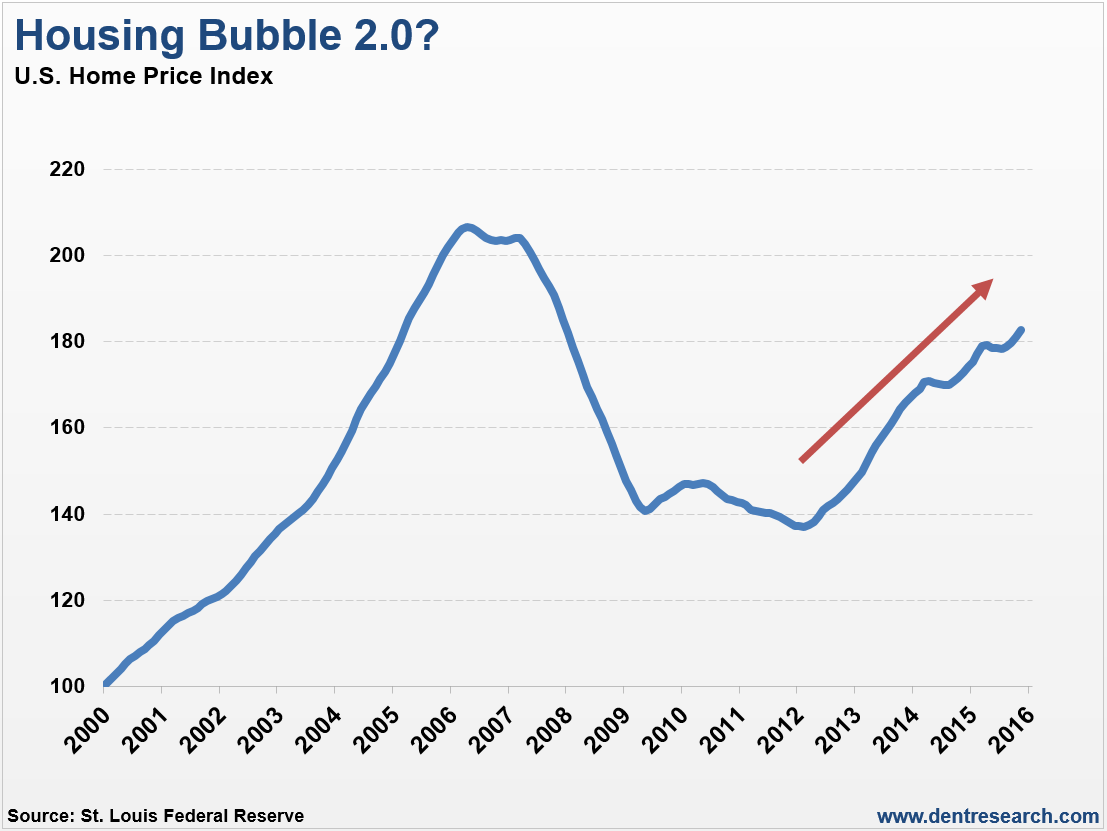
Seems okay. Next, look below at home prices over the same period:

It follows a similar pattern, except it seems as if we’re quickly approaching price levels seen at the top of the bubble! After peaking in 2006, housing prices bottomed in 2012, and then the hedge funds started buying single-family homes as investment properties. This started the price rise, and the Fed’s continued low interest rate policy has fueled the rise.


Leave A Comment