
Flattening may fatten investors’ wallets
Even though the Federal Reserve hasn’t tinkered with the Fed Funds target rate since June, interest rates have been ratcheting upward in anticipation of the next reset. Fed Funds are at the extreme left end—the short end—of the yield curve. The rate applies to overnight interbank loans of excess reserves.
The central bank has direct leverage on the overnight lending rate, but as you move to the right of the yield curve, Fed influence wanes.
You can see what’s happened to the yield curve over the past year in the chart below. As the Fed snugged, then jawboned, rates at short end rose while nothing much happened at the long end. The result? A flattening yield curve.
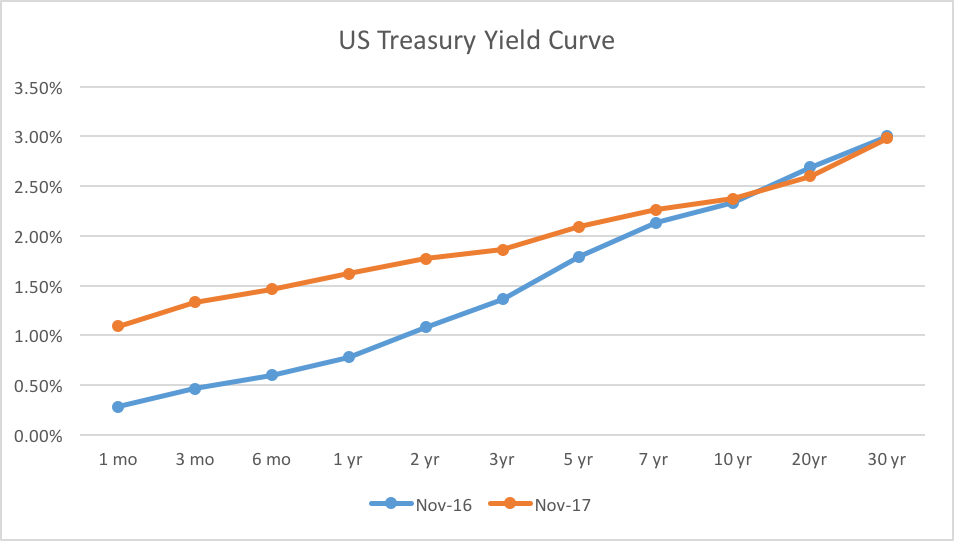
While the end-to-end flattening has been very dramatic, the effect on the middle of the curve—where many banks and financial institutions are exposed—was no less striking, The two-to-ten year span is most closely watched as a barometer of bank health. In the past year, it’s been more than halved.
That’s been good news for owners of the iPath US Treasury Flattener ETN (Nasdaq: FLAT), a lightly traded note that provides inverse (-1x) exposure to the Barclays US Treasury 2/10Y Yield Curve Index. The note’s underlying index represents notional investments in Treasury futures by simulating the purchase of two-year note contracts in a three-to-one ratio to the sale of ten-year note futures. The ratio brings the trade into duration neutrality. The index rises as the yield curve steepens, that is when ten-year notes fall (and rates rise) in relation to two-year notes. FLAT, tracking the index’s inverse, gains value when the curve flattens.
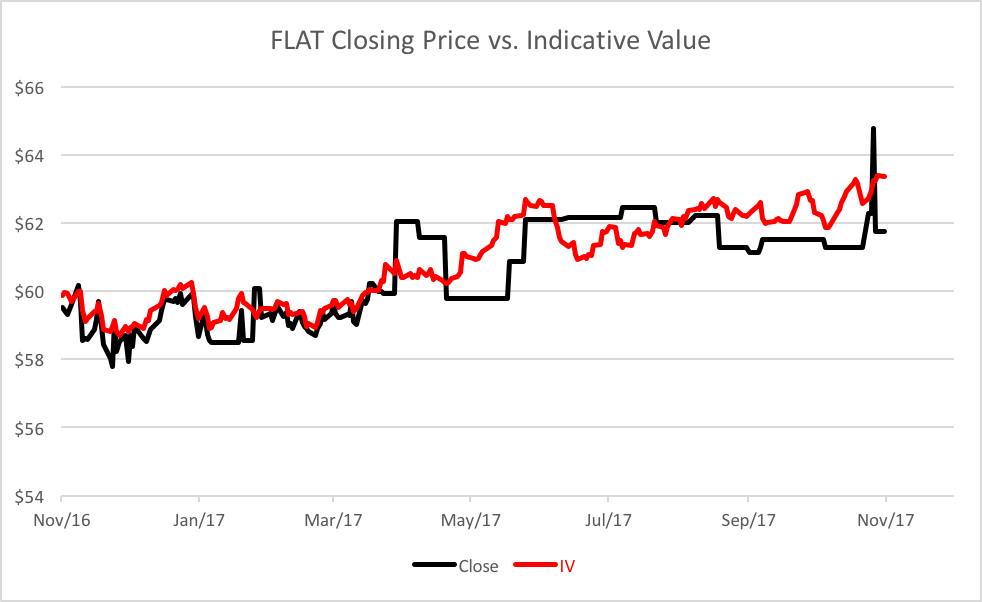
Trading interest in the ETN has waned at precisely the time that the note could have been most useful to investors. You can see this reflected in the chart depicting the note’s closing prices and indicative values. Indicative values for exchange-traded notes are analogous to the net asset values for mutual or exchange-traded funds.


Leave A Comment