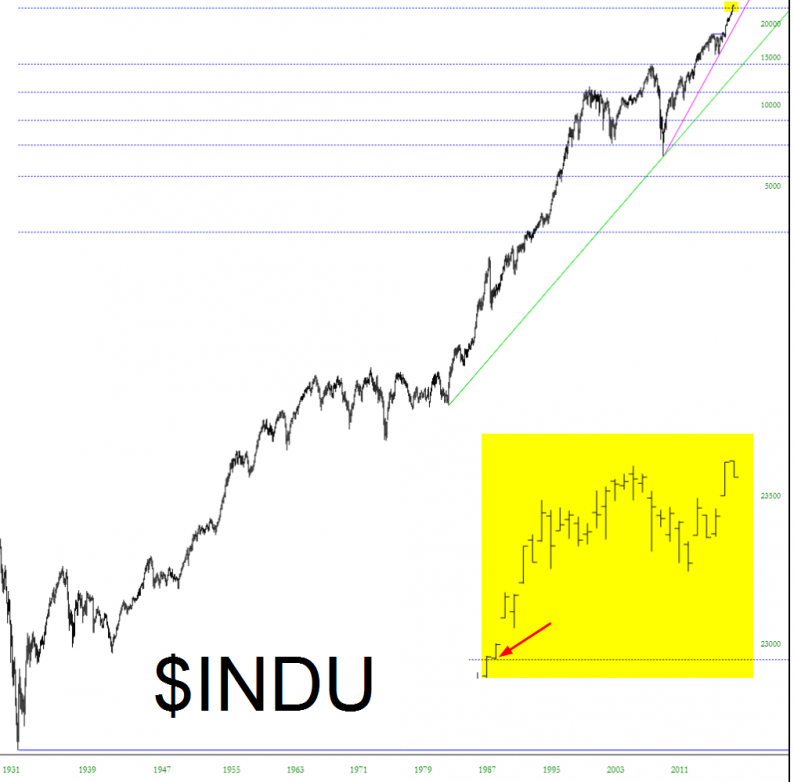
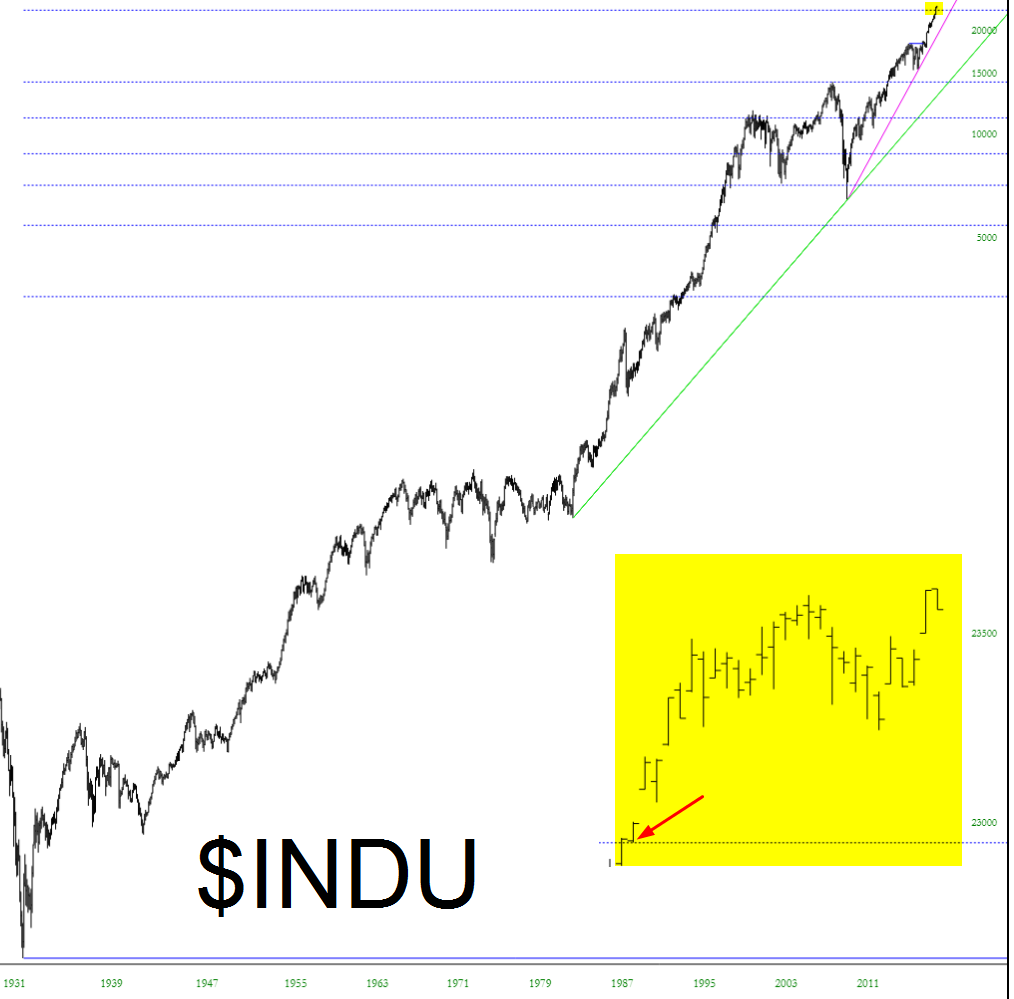
On this quiet holiday weekend, I thought I’d share a couple of very long-term charts. Here’s the Dow 30 featuring Fibonacci retracements and a projection. As you can see, the projection has been exceeded (see inset); in the normal world, this is called a “failure”, but in the world of charting, it’s a “throwover.”
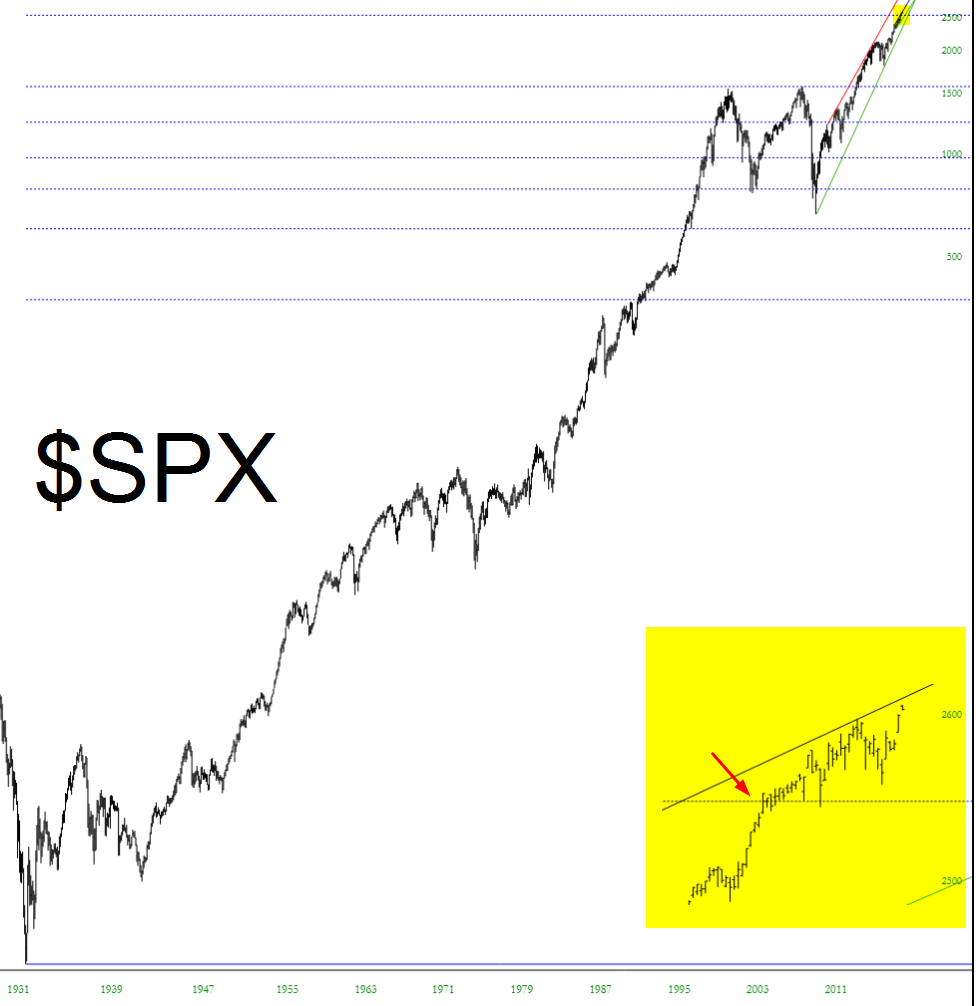
A similar study is shown on the S&P 500. In each of these cases, the bottom anchor point is at the depths of the Great Depression.


Leave A Comment