On Thursday morning, as the market dropped below its 200-dma, I got numerous emails asking about the break. I wrote the following in response:
“I have often discussed that as a portfolio manager I am not too concerned with what happens during the middle of the trading week. The reason is daily price volatility can lead to many false indications about the direction of the market. These false indications are why so many investors suggest that technical analysis is nothing more than ‘voodoo.’
For me, price analysis is more about understanding the ‘trend’ of the market and the path of least resistance for prices in the short and intermediate-term. This analysis allows for portfolio positioning to manage risk.
Over the last several weeks, I have been mapping out the ongoing correction in the market and have noted the important support that has been provided by the running 200-day moving average. The chart below is updated through this morning.”
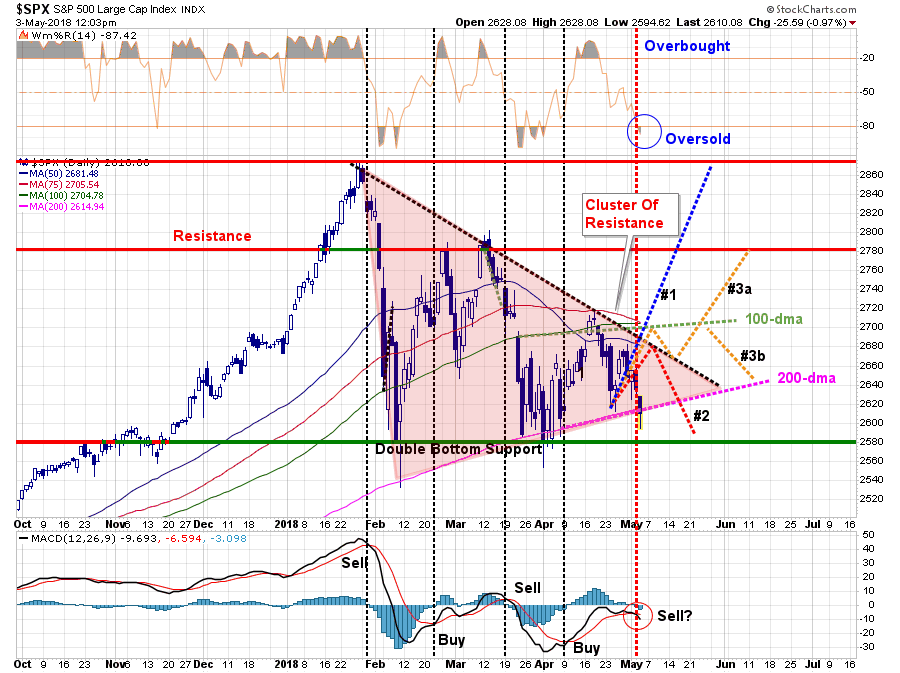
“The break of the 200-dma today is not a good sign. Consolidation processes are much akin to the “coiling of a spring.”As prices become compressed, when those prices break out there is a “release of energy” from that compression which tends to lead to rather sharp moves in the direction of the breakout.
Importantly, the break of support today is NOT a signal to run out and sell everything. It is, however, a worrisome warning that should not be entirely dismissed.
As stated, nothing matters for me until we see where the market closes on Friday.”
Of course, almost immediately after posting that article, the market began to rally back and closed in the green, and above the 200-dma, thereby negating the break.
In other words, despite all the volatility, nothing changed (for better or worse) which would affect our current portfolio allocations.
So, with that said, let’s update the progress on our potential pathways from last week.
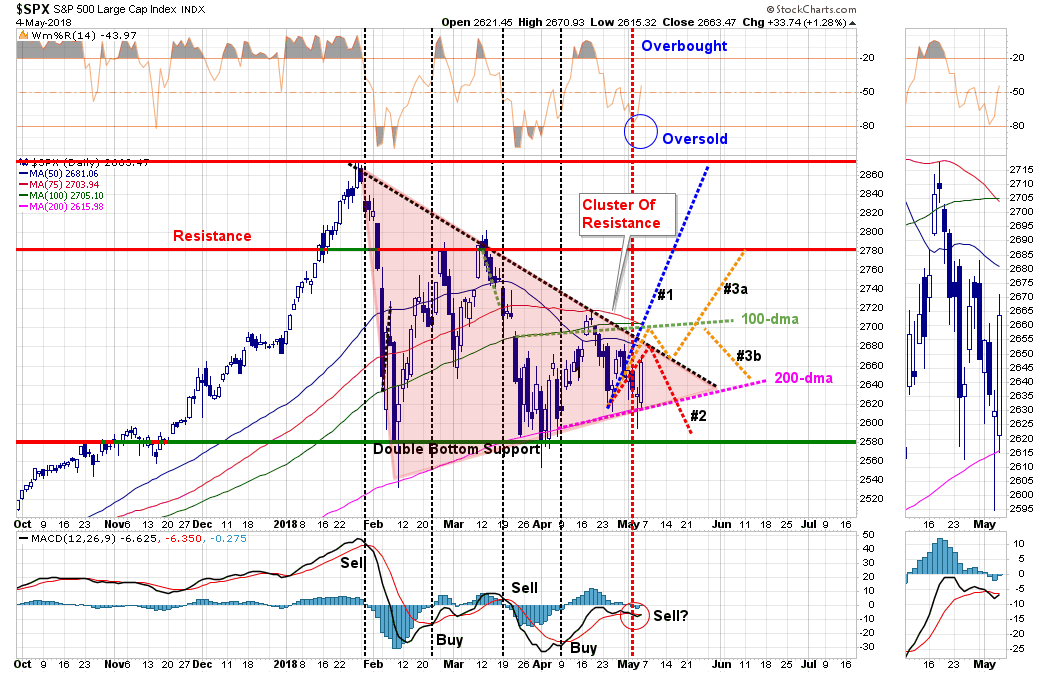
As stated, the market did defend its 200-dma and is very close to reversing its short-term “sell signal.”
That’s the good news.
The not so good news is that while the market did muster a rally on Friday, it still remains well-entrenched within the ongoing consolidation/correction process.
Interestingly, as I stated on Thursday’s radio broadcast:
“A bad employment number may actually be ‘good’ for the market. If the number comes in weaker than expected this will likely ease concerns about more aggressive Fed rates hikes which could buoy stocks.”
Not surprisingly, that is exactly what happened.
The problem is that with all the economic data coming in weaker than expected, this may well be a very short-lived rally.
In reviewing our three primary pathways above, pathway #3a and #3b remain the most viable currently. From last week’s missive:
Simply, we can not predict the future, we can only react to it. These pathways are educated “guesses” of where the market may trade. However, without analysis of what “might” happen, the process of portfolio management becomes nothing more than a dart throwing contest. Such tends to not work out well.
This is why we have raised cash over the last couple of months on rallies. Currently, given the backdrop of the intermediate-term outlook, updated below, there isn’t much we need to do at the moment.
However, the weakness in the market, combined with longer-term sell signals as discussed on Tuesday, still suggests the market has likely put in its top for the year.
We remain cautious and suggest the time to “buy” has not yet arrived.
Intermediate-Term Picture Remains Bearish
On an intermediate-term basis, both of our weekly “sell signals” remain, and as shown below, despite the sharp rally on Friday, the market once again failed at its overhead trend line and closed lower for the week. Furthermore, the intermediate-term moving average has turned sharply lower and is beginning to threaten crossing below the longer-term average. This is not a good setup for a bull market continuation.
With confirmed “sell signals” still firmly intact, the easiest path for prices currently remains lower. This does not mean you can not have sharp reversal rallies from short-term oversold conditions as we saw last week, but those rallies should be used to reduce risk.


Leave A Comment