This is the Short version :
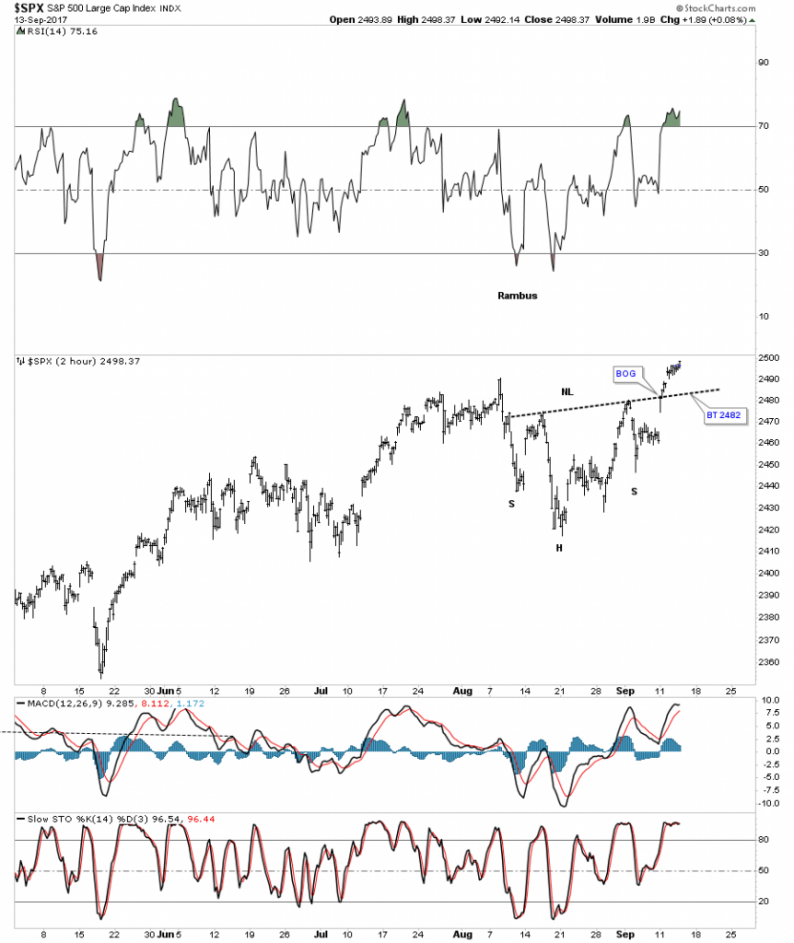
On the 2 hour charts I’ve spotted several small H&S bottoms building out on some of the stock market indexes. It wasn’t until Monday of this week that they began to show themselves when several broke out above their necklines. Some of these small H&S bottoms are part of a bigger pattern that has been building out for most of this year. At a minimum their price objectives should get some of the stock market indexes back up to the top of their 2016 uptrend channels.
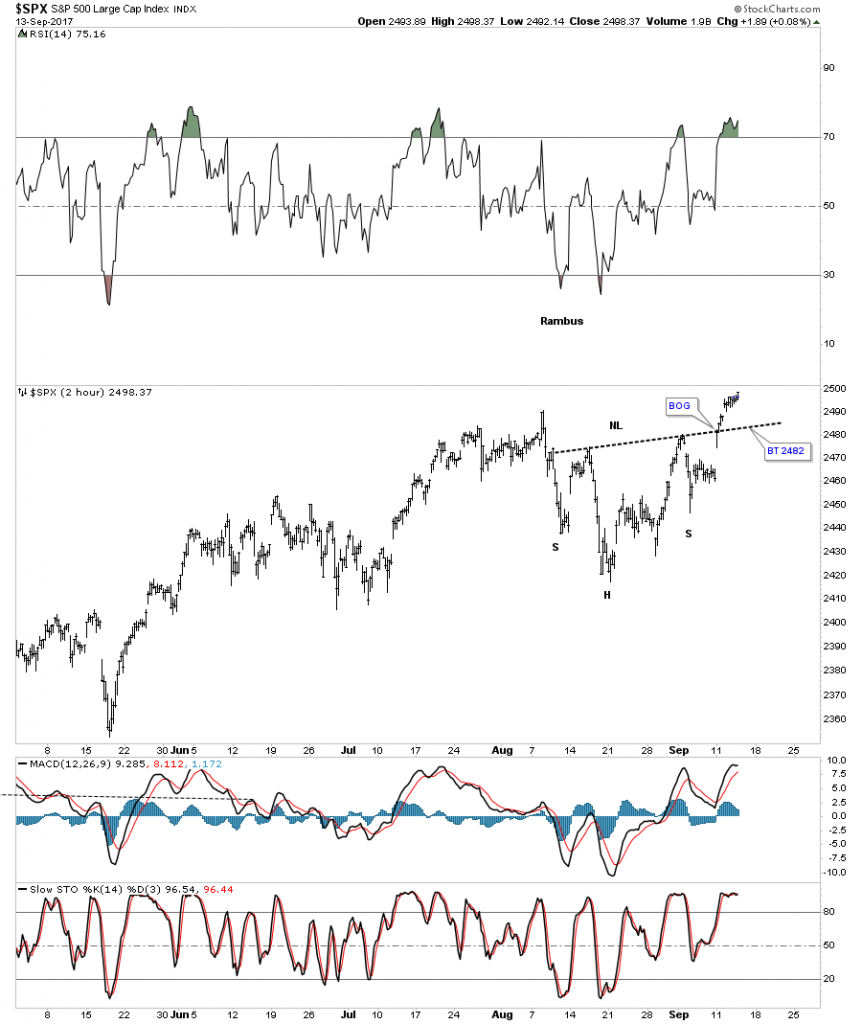
Lets start with a 2 hour chart for the SPX which shows it gapped above its neckline on Monday of this week and closed at a new all time high today. A backtest to the neckline would come in around the 2482 area.
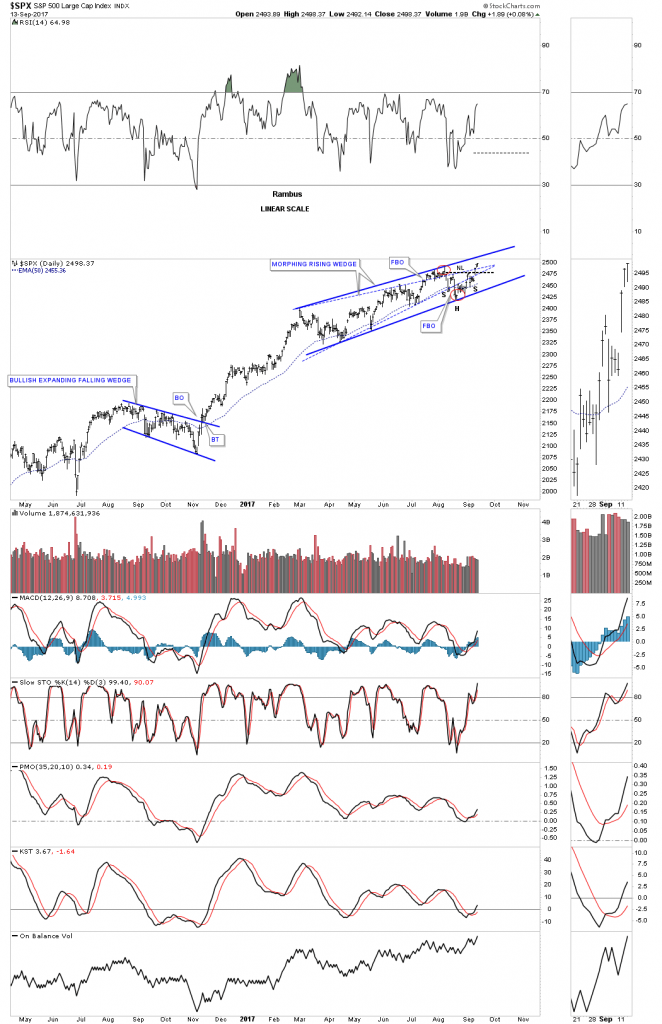
Several weeks ago I posted this chart which was showing how the original rising wedge, blue dashed trendiness, was morphing into a bigger pattern as shown by the red circles with a symmetry false breakout of the top and bottom blue dashed rails. It’s getting pretty busy in the apex, but you can see how the small H&S bottom fits into the bigger pattern that began building out back in February of this year. If that little H&S bottom plays out it strongly suggests the SPX is going to breakout topside from that 7 month morphing rising wedge in a new impulse leg up.
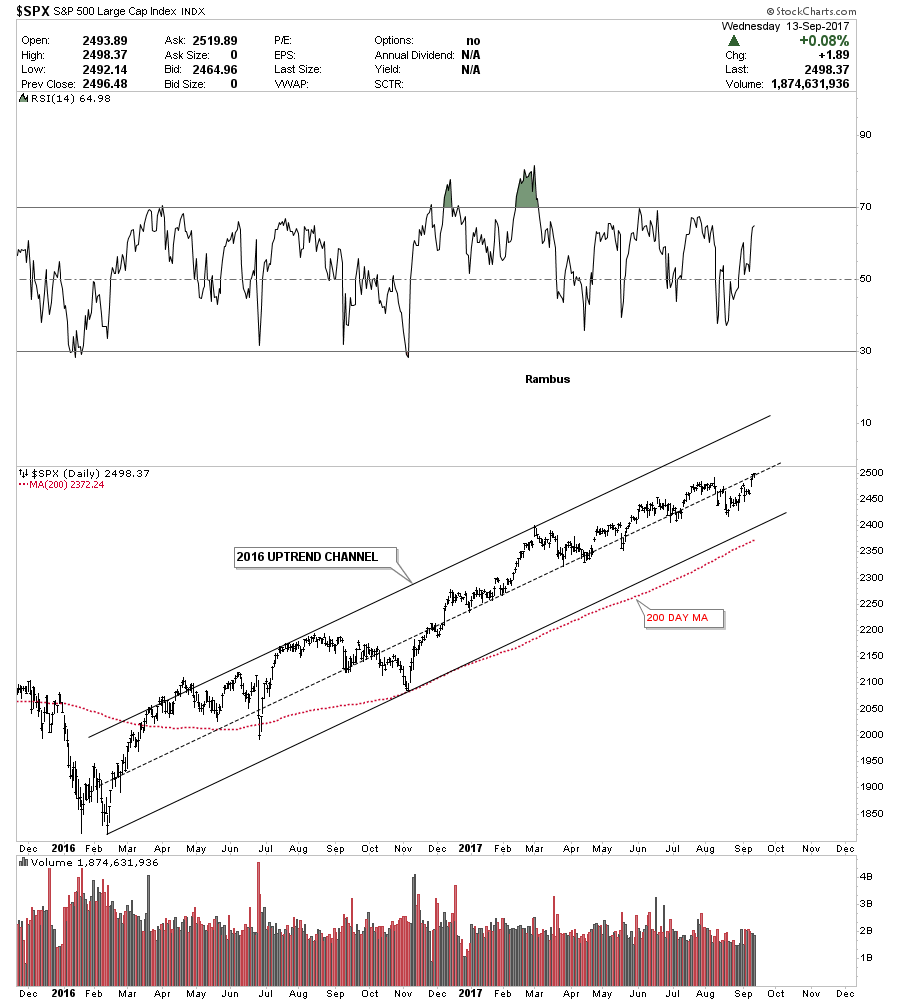
Below is a 2 year daily chart for the SPX which just shows its 2016 uptrend channel. On many of the stock market indexes the 200 day moving average does a good job of showing you the angle of the uptrend channel.
Perspective is everything when you discover what may be an important chart pattern. The weekly chart below shows the 2 year H&S consolidation pattern that corrected the last impulse move up. Now you can see how the blue morphing rising wedge fits into the very big picture. Keep in mind the rising wedge hasn’t broken out yet so the pattern isn’t complete. The reason I think the rising wedge is going to breakout topside is because we are in a bull market and patterns like this tend to form in strong bull markets. If we do get the upside breakout from the rising wedge I would view it as a halfway pattern that would have formed between the neckline and the ultimate price objective.


Leave A Comment