Commercial bankruptcies are skyrocketing, oil prices have collapsed, profits have declined and Central Banks globally are pushing negative interest rates in hopes of keeping economies afloat. At any other point in history, such a combination of events would have investors scrambling for cover as market prices fell.
Currently, however, the majority of the mainstream analysis continues to ignore past history as stock prices are just within reach of all-time highs. The assumption “this time is different” is based solely on a continued low-interest rate environment promulgated by the Federal Reserve.
However, since I was long ago excised by the media for allowing the “data to speak,” let me clarify why I still believe the “bearish” case will still likely come to fruition.
Economic Hopes To Be Disappointed
Despite ongoing hopes of a resurgence of economic growth over the past six years, each year has only led to disappointment. As I discussed previously:
“If you are expecting an economic recovery, and a continuation of the bull market, then the economic data must begin to improve markedly in the months ahead. The problem has been that each bounce in the economic data has failed within the context of a declining trend. This is not a good thing and is why we continue to witness an erosion in the growth rates of corporate earnings and profitability. Eventually, that erosion combined, with excessive valuations, will weigh on the financial markets which is potentially much of what we are witnessing now.
The economy continues to ebb and flow between weak growth and no growth. This puts the Federal Reserve at risk of a policy mistake that could trip the economy into an outright recession. While there have certainly been positive bumps in the data, as pent-up demand is released back into the economy, the inability to sustain growth is most concerning.”
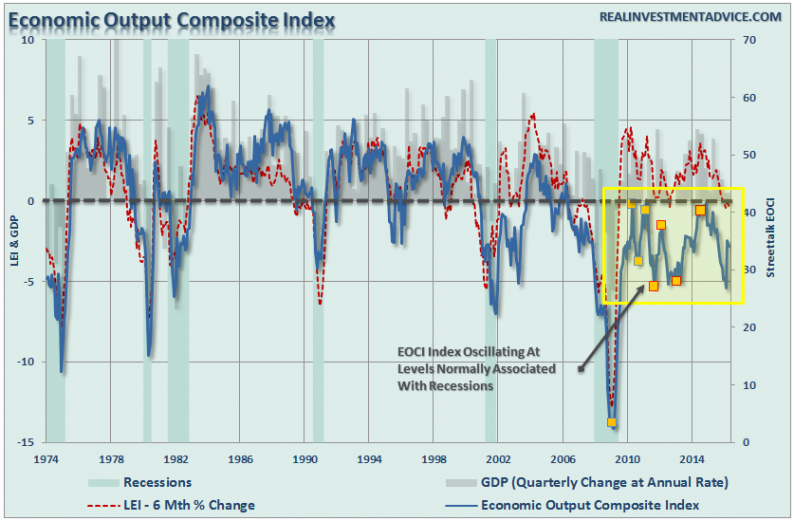
This “ebb and flow” within a weakening trend can be most clearly seen in the Economic Output Composite Index. As shown, recent hopes of a resurgence in economic growth have all but faded as the data has plunged to levels normally more associated with outright recessions.

If we turn the index into a recession indicator by only looking at when the index falls below 35, we see the following.
(The recession indicator uses a 6-month average to smooth out the month-to-month volatility caused by seasonal adjustment anomalies as we are currently witnessing.)


Leave A Comment