The great recession of 2008-9 followed an extraordinary house price bubble. The sluggish was characterized by a very slow recovery of residential investment. Oddly, the extensive revision of macroeconomic models which implied a very low probability of great recessions has not involved a focus on housing. Instead, it has focused on financial frictions – essentially it is assumed that the 2008-9 recession was extraordinary because a major financial crisis occurred. Dean Baker dissents (as he often does) arguing that the severity of the recession could have been predicted given the massive decline in housing prices and earlier estimates of the effect of home equity on consumption. This note attempts to being to assess that claim. It also asks if it is possible to forecast GDP growth over the medium term. Finally it is part of the Rip Van Keynes series because I will use an empirical strategy which has been out of fashion for at least four decades – basically an ad hoc OLS regression (sometimes I even include an exponential trend).
The basic result is that if the relative price of housing is high (compared to an exponential trend) then GDP growth over the following 5 years is low (compared to an exponential trend). Aiming to test out of sample forecasting, I start using 20th-century data only.

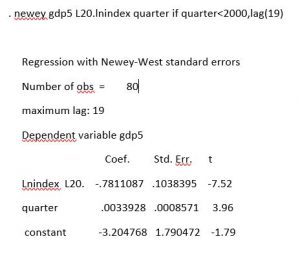
-7.52 is a fairly impressive t-statistic.
Lnindex L20 is the logarithm of the ratio of the all transactions house price index to the consumer price index lagged 20 quarters. Gdp5 is the growth of the logarithm of real gdp over the past 5 years. Quarter is the calender quarter up to the 4th quarter of 1999 = 1999.75. The data were downloaded from Fred and are described in what might be generously considered a sort of data appendix. One point must be mentioned here – the all transactions house price index is available only starting in 1975, so the first useful observation is growth of GDP from 1975q1 to 1980q1.
The series are quarterly, so the dependent variable is a moving average of changes summed over 20 quarters. In the crudest attempt to deal with this, I calculate Newey West standard errors with 19 lags. These would be valid if log GDP were a random walk with drift (the constant) and trend (growth slowdown).
This regression is at least a hint that 8 years before the great recession began, there was already evidence that extremely high relative price of housing was likely to be followed by low GDP growth. Because the regression is, at best, barely presentable, I focus on out of sample forecasting. pgdp5 is the fitted value which can be considered a very crude forecast of real gdp growth over the following 5 years.
Out of sample the forecasts and outcomes are positively correlated. The correlation of pgdp5 and gdp5 over 2000q1 through 2018q1 is over 0.86. Out of sample forecasts of GDP growth over the following 5 years seem to be quite useful. This may be simply due to the estimated trends.


Leave A Comment