It always fascinates me how technical analysis is, more often than not, confirmed by some event. As I noted in last week’s missive:
“Currently, the ‘bulls’ remain clearly in charge of the market…for now. While it seems as if much of the ‘tariff talk’ has been priced into stocks, what likely hasn’t, as of yet, is the rising evidence of weakening economic data (ISM, employment, etc.), weakening consumer demand, and the impact of higher rates.
While on an intermediate-term basis these macro issues will matter, it is primarily just sentiment that matters in the short-term. From that perspective, the market retested the previous breakout above the March highs last week (the Maginot line) which keeps Pathway #1 intact. It also suggests that next week will likely see a test of the January highs.”
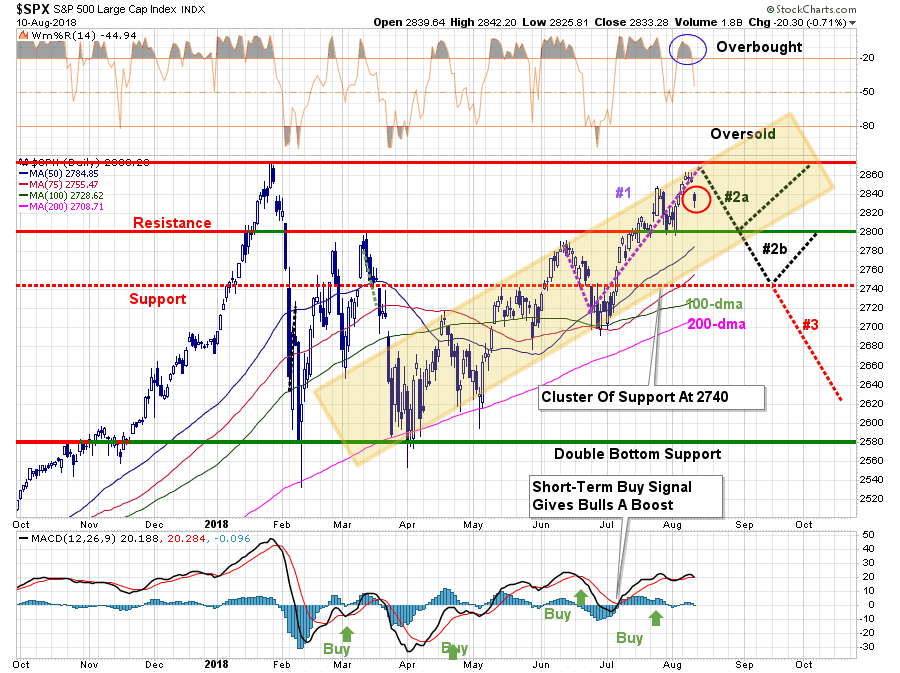
“With moving averages rising, this shifts Pathway #2a and #2b further out into the August and September time frames. The potential for a correction back to support before a second attempt at all-time highs would align with normal seasonal weakness heading into the Fall.”
As shown in the updated “pathway chart” above, the market did indeed attempt to test all-time highs in the market. But, as I noted, the overbought condition provided the fuel for a correction given the right catalyst.
That catalyst appeared on Friday as the Lira plunged and Turkey edged closer to an economic crisis. As Daniel LaCalle noted:
“The Turkish Lira collapse should have surprised no one. Yet, in this bubble-justifying market, it did.”

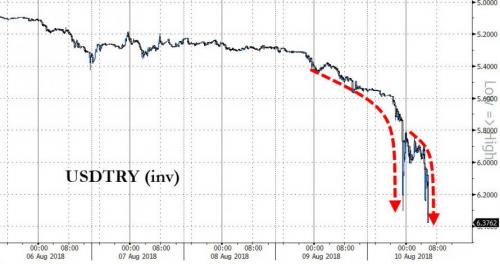
“First and foremost, the lira decline has been ongoing for some time, and has nothing to do with the strength of the US dollar in 2018
The collapse of Turkey was an accident waiting to happen and is fully self-inflicted.”
We will come back to Turkey in a moment, but the important point here is with the market overbought, and extended following the recent run, we have been suggesting that holding onto cash in the short-term may be wise. As noted last week:
“With our portfolios nearly fully allocated, there are not a lot of actions we need to take currently as the markets continue to trend higher for now. We will continue to monitor our exposure and hedge risk accordingly, but with the weekly ‘buy signal’ registered, we are keeping our hedges limited and are widening our stops just a bit.
As noted above, a short-term correction is needed before adding further equity exposure to portfolios.”
Also, last Tuesday, I discussed the bond yields were potentially signaling a problem for the market.
“On a very short-term basis, the 10-year Treasury yield has started a potential-topping process. Given that ‘yield’ is the inverse of the ‘price’ of bonds, the ‘buy’ and “sell” signals are also reversed.
As shown below, the 10-year yield appears to be forming the ‘right shoulder’ of a ‘head and shoulder’ topping formation and is currently on a short-term ‘buy’ signal. Such would suggest lower yields over the next couple of months.”
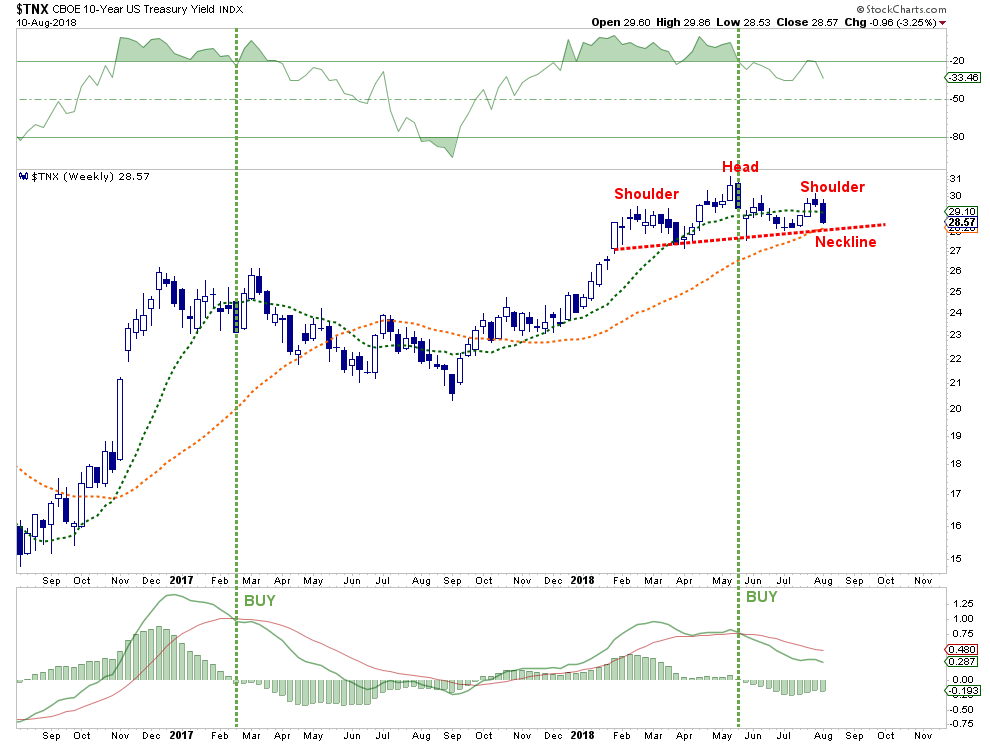
“The two ‘bond buy; signals above aren’t a rarity. The chart below expands this view back to 1970. There have only been a few times historically that yields have been this overbought and trading at 3 to 4 standard deviations above their one-year average.”
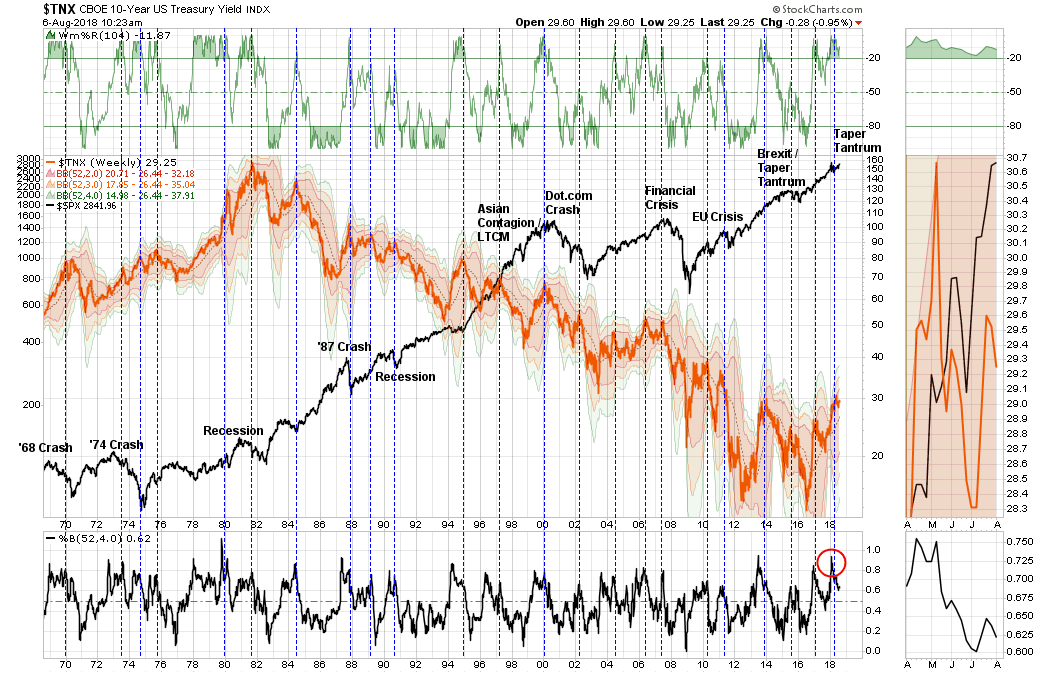
“The outcome for investors was never ideal.”
Now, back to Turkey.
Over the last couple of weeks, I have been repeatedly discussing the importance of rising geopolitical stresses from Iran, to Russia, China, and now Turkey. The common thread to all of these can be traced back to the current Administration and the fiscal policies currently being implemented.
While “tariffs” and an ongoing “trade war” have been largely dismissed in recent weeks in the exuberance to push the financial markets to all-time highs, the economic realities of higher interest rates, rising input costs from tariffs, economic impacts from sanctions, and tighter global liquidity are not a healthy mix for the economy or the markets.
Turkey is a far more relevant risk to the global economy than Greece was. As Daniel notes:
“On one hand, the exposure of eurozone banks like BBVA, BNP, Unicredit to Turkey is very relevant.Between 15% and 20% of all assets.
On the other hand, the rise in non-performing loans is evident. Turkey’s loans in US dollars account for around 30% of GDP according to the Washington Post, but loans in euro could be as much as another 20%. Turkey’s lenders and governments made the same incorrect bet that Argentina or Brazil made. Betting on a constantly weakening US dollar and that the Federal Reserve would not raise rates as announced. They were -obviously wrong. But that erroneous bet only adds to the already existing monetary and fiscal imbalances.”
Not bailing out Turkey,on the other hand, would cause amuch larger crisis than Greece was.”
A Risk Without A Backstop
While many will likely quickly compare the current “Turkey Tragedy” with “Greece” and deem it to be a “non-event,” there is one difference you may want to pay attention to.
During the entirety of the Greek, Ireland, and Cyprus economic disasters, not to mention Brexit, the Federal Reserve was hard at work suppressing interest rates and pushing an unprecedented amount of liquidity into the financial markets. Not only was the Fed fast at work, but was joined by the Central Banks of Europe, China, Japan, and England. The chart below shows the timeline of the Greek crisis as compared to the S&P 500 and the Fed’s balance sheet.


Leave A Comment