
Each month, I scan for stocks in the major averages that have positive or negative momentum, as well as for those that are quite overbought or oversold. This is accomplished by looking at where stocks closed the month in relation to their starc bands. This analysis, like my regular weekly scan of stocks, provides a list of stocks for further analysis and recommendation.

Traders work on the floor at the New York Stock Exchange on August 9, 2018 in New York. (Photo credit should read BRYAN R. SMITH/AFP/Getty Images)
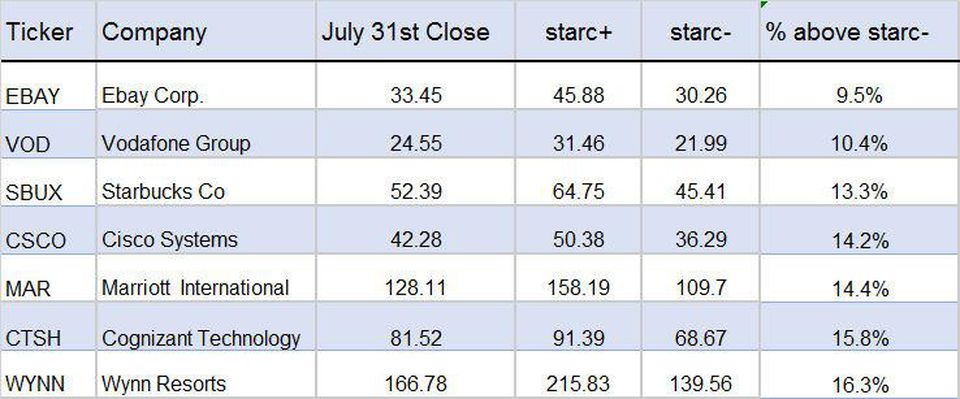
In my May 5 article, “The Five Most Oversold Dow Stocks”, I discussed my use of the starc band analysis to determine overbought or oversold stocks: “When a stock or ETF closes near its upper starc band (starc+), it is considered to be a high-risk buy and therefore overbought. Conversely, a close near the lower starc band (starc-) indicates that a stock is a high-risk sell area and is oversold.“
Of the Dow stocks, United Technologies Corp (UTX) and DowDupont (DWDP) looked the most interesting back in May. As of the July close, UTX is up 12.7% and DWDP is up 8.7%. Of the five stocks mentioned in that article, only Proctor & Gamble (PG) is lower from the April close.
TOM ASPRAY – VIPERREPORT.COM
The most oversold Nasdaq 100 stock after the July close is eBay, Inc. (EBAY), which closed just 9.5% above its monthly starc- band. EBAY is down well over 9% so far in 2018. In August, eBay Corp and Cisco Systems (CSCO) have moved a bit higher, up 2.1% and 3.5%, respectively. The rest have declined so far in August, with the most serious declines in Wynn Resorts (WYNN), down 8.8%, and Cognizant Technology (CTSH), down 6.5%.
TOM ASPRAY – VIPERREPORT.COM
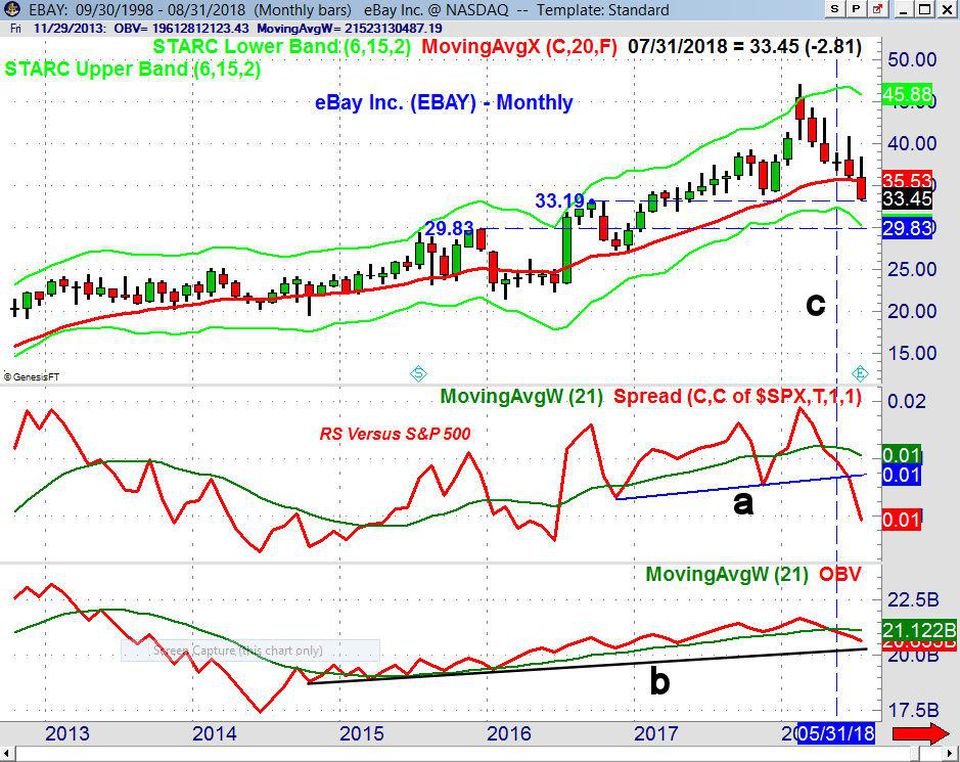
The monthly chart of eBay Corp. shows that it has declined for five months in a row, finally falling to support from the 2016 high at $33.19. There is even stronger support from 2015 in the $29.83 area. The monthly relative performance (RS) for eBay dropped below its WMA in April, signaling that it was going to be weaker than the S&P 500. The violation of RS support (line a) is even more negative. The weekly OBV dropped below its WMA in May but is still above the long-term support (line b).


Leave A Comment