
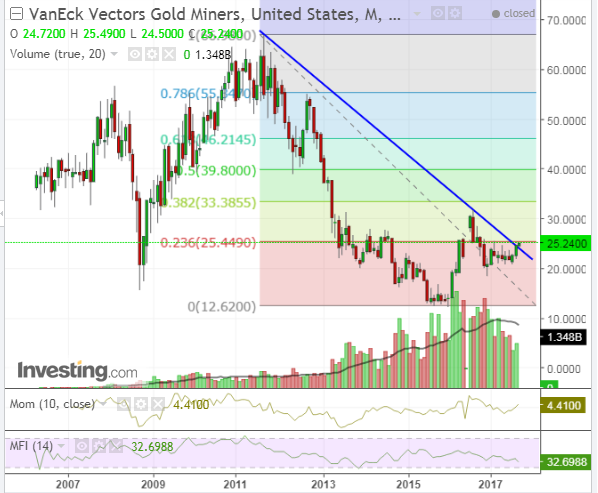
Price on the following GDX Monthly chart is currently being squeezed in between major resistance of a 23.6% Fib retracement level and a recent breakout above a long-term downtrend line.
We’ll see if it continues to rally — maybe to 30.00 or even 33.00 — but there is a lot of overhead price supply, so that could be quite a long shot. I’d like to see Money Flow firm up on any further advancement, as that indicator is currently in downtrend on this longer timeframe.
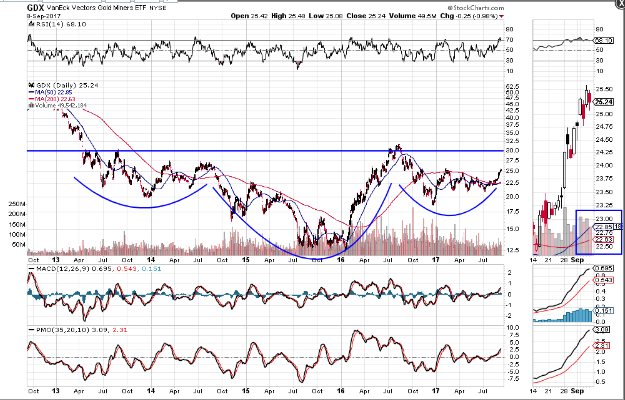
In the shorter term, price is now under the bullish influence of a new Golden Cross moving average formation, as shown on the following Daily chart, along with rising RSI, MACD and PMO indicators, so I’d watch for a retest of a potential reverse Head & Shoulders neckline at 30.00.
Price on GDX has been advancing along with that of Gold, as it also approaches its neckline of a reverse Head & Shoulders formation at 1376, as I described in my post of August 28. On Friday, Gold made a high of 1362.40 and closed at 1351.20.
So, these are two to watch to see if they continue to gather strength, or not, in the coming days/weeks.


Leave A Comment