
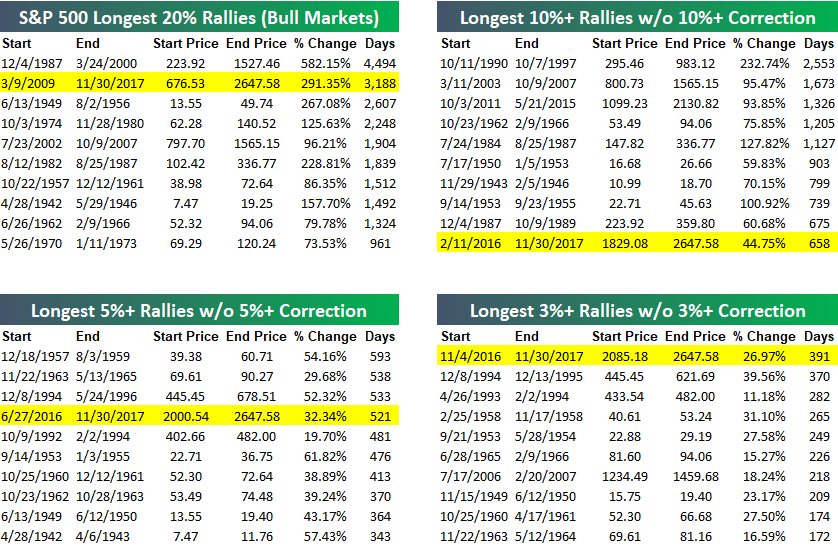
Despite a seemingly endless number of events that investors could easily use as justification to take profits, US equities just keep marching higher. While the magnitude of the gain this year has been far from record-breaking for a calendar year, the consistency has been without precedent by some measures. The tables below from our most recent Bespoke Report serve as an example of how Teflon the market has seemingly become as the S&P 500 is in its second-longest bull market, the tenth longest streak without a 10% correction, the fourth longest run without a 5% decline, and the longest rally ever without even a 3% decline. At some point, the market’s luck will run out, but betting on when that will be has been tough on the wallet so far.
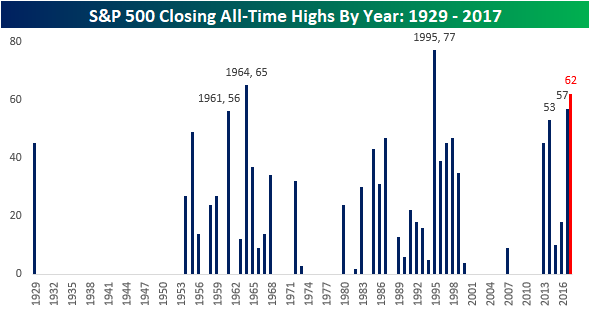
With the S&P 500 showing steady gains throughout the year, it seems a day doesn’t go by where we aren’t seeing new record highs. The chart below shows the number of all-time record closing highs for the S&P 500 on an annual basis since 1929. With 57 records (not including today) so far this year, 2017 ranks as the third most all-time closing highs for a calendar year behind 1995 (77) and 1964 (65). Unfortunately, with 19 trading days left in the year, it is now mathematically impossible for this year to overtake or even tie 1995’s 77 record highs, but 1965’s total of 65 is still within reach. Even that, though, will be tough as eight of the year’s final 19 trading days would need to be record highs to just tie for second all time. If the final few weeks of 2017 simply keep up the current pace of the first eleven months of the year, 2017 would finish with a total of 62 all-time closing highs. Still not a bad total by any stretch.


Leave A Comment