
The U.S. stock market has been very volatile recently, swinging up and down more than 1% each day.
From September 2018 – present the S&P has fallen -10.8%, while from January – February 2018 the S&P fell -11.8% (using daily HIGH and LOW prices). So the magnitude of these 2 corrections has been very similar.
Let’s analyze the stock market’s price action by objectively quantifying technical analysis. For the sake of reference, here’s the random probability of the U.S. stock market going up on any given day, week, or month.

*Probability ? certainty. But if you consistently trade against probability, then you will underperform in the long run.
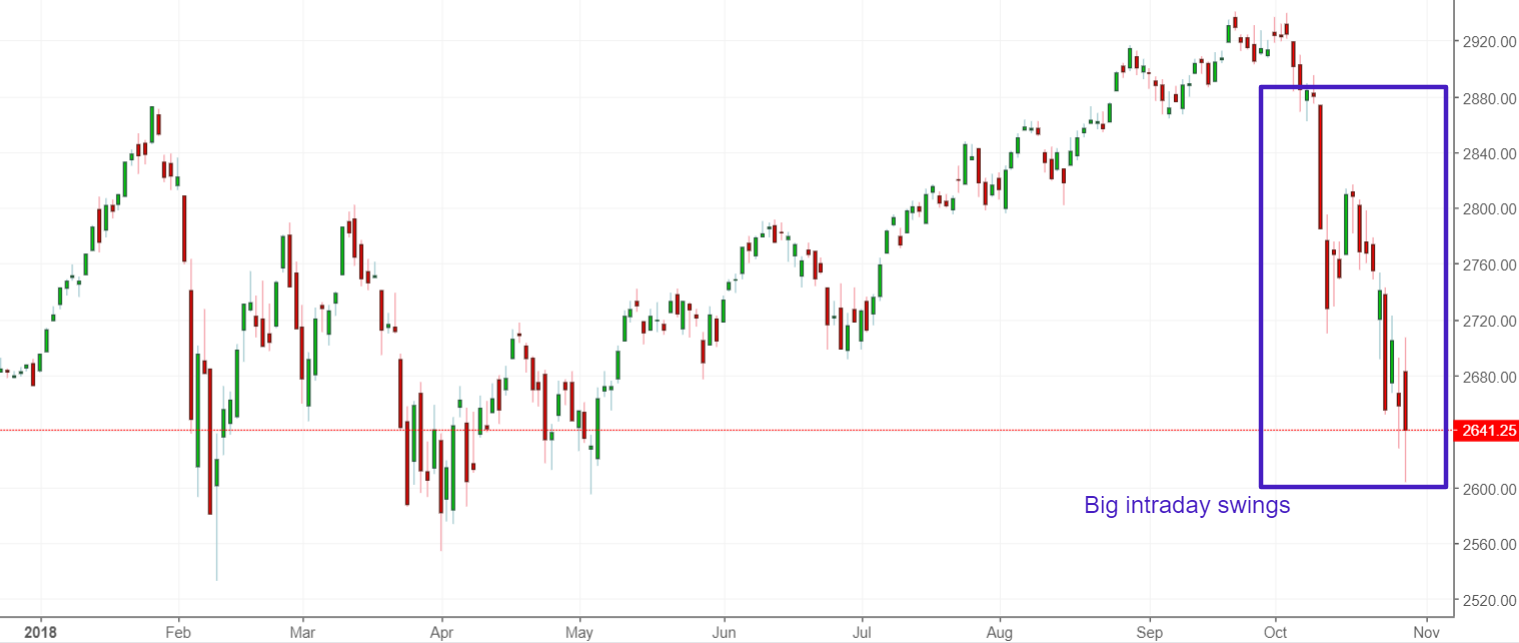
S&P 500 has been very volatile during the intraday
The U.S. stock market went up more than 1.8% yesterday, and then closed more than -0.5% below the previous day’s close. That kind of intraday volatility is uncommon.
Is this a sign of “holy shit there are no buyers out there!!!!”?

Here’s what happened next to the S&P 500 when the S&P’s daily high is more than 1.8% above yesterday’s close, and the S&P’s CLOSE is more than -0.5% below yesterday’s CLOSE (i.e. a big failed bounce)
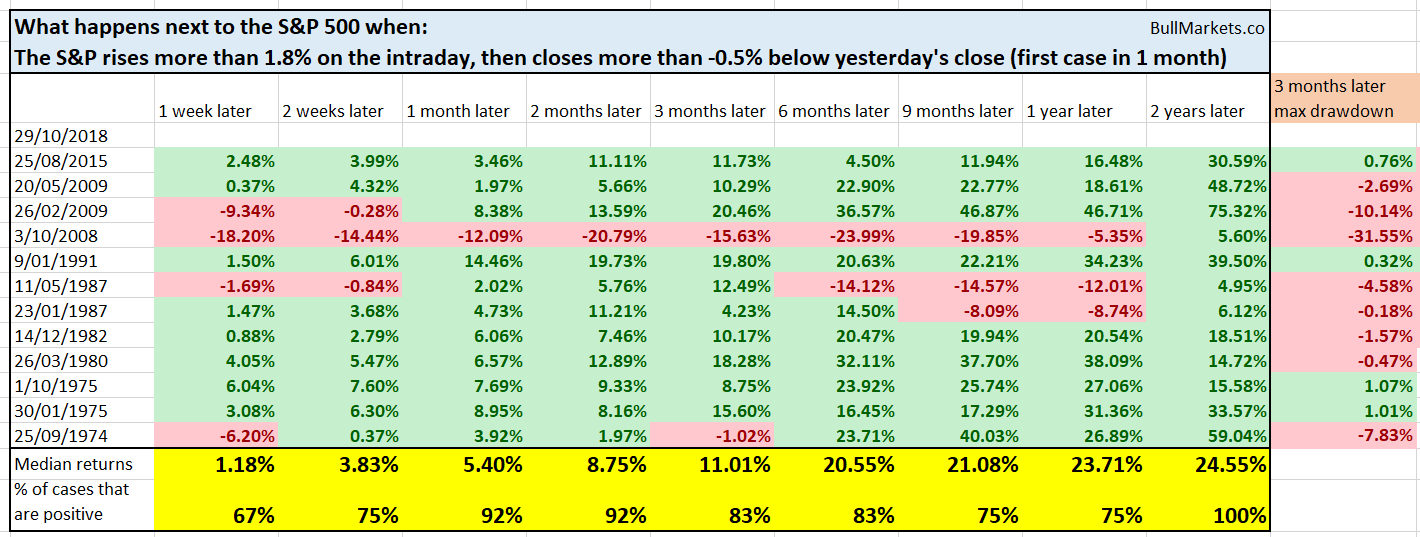
As you can see, the S&P tends to go up 1-3 months later. Somebody is trying to buy the dip. It doesn’t always succeed on the first try, but eventually, it does.
“This stock market crash is just like the dot-com top!!!!”
The S&P has gone down in 21 out of the past 27 trading days.
I saw this one very popular tweet on Twitter saying “in the past 35 years, there has only been 1 other case in which the S&P fell 21 out of the past 27 days – that was November 2000”
Financial media, permabears, and other “the world is ending” people love to use n=1 “bearish” studies. It allows them to “prove” that the world is ending. Bad news is good for attracting media attention and ad $$$.


Leave A Comment