Our benchmark S&P 500 opened in the shallow red and sold off to its -0.25% intraday low about 30 minutes later. It then rose steadily to its 0.94% afternoon high before some late volatility trimmed the St. Patrick’s Day gain to a more modest 0.66%. The index is down a mere 0.16% year-to-date. Its elderly cousin index, the Dow, rose 0.90% and thus celebrated St. Patrick’s Day appropriately enough with its first YTD day in the green, up 0.32% from its 2015 close.
The yield on the 10-year note closed at 1.91%, another three bps from the previous close.
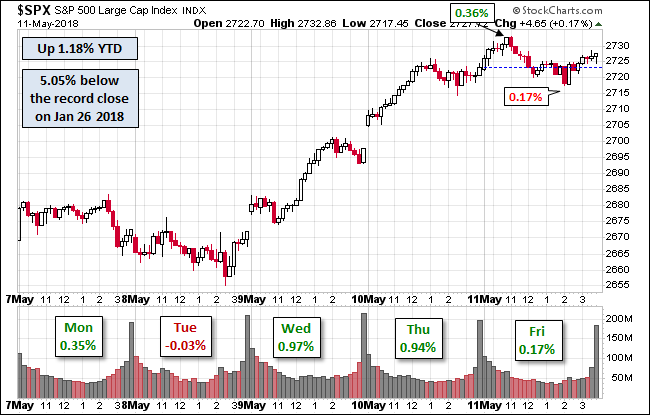
Here is a snapshot of past five sessions in the S&P 500.

Here is a daily chart of the index. Volume remains below its 50-day moving average.

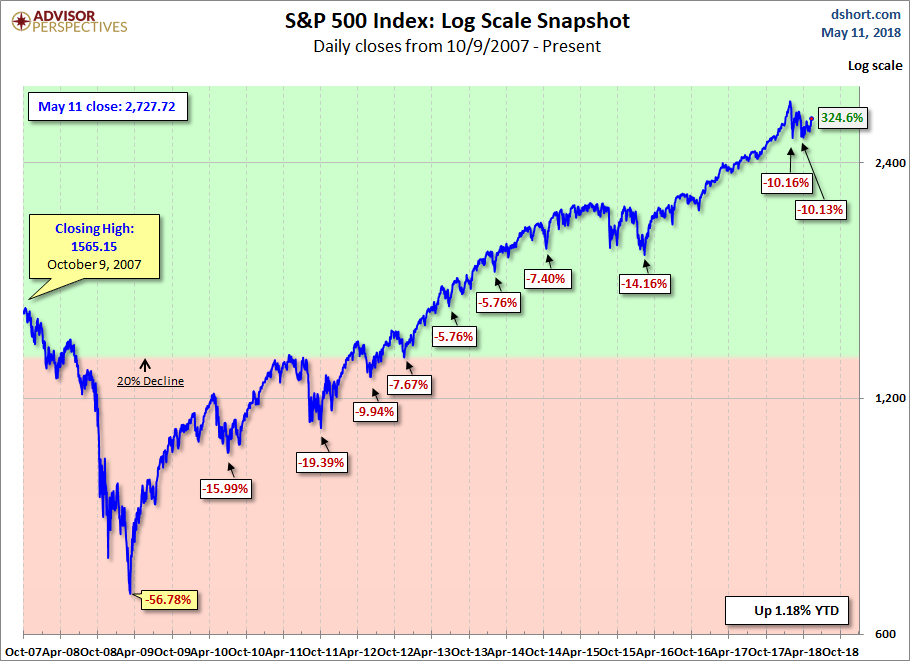
A Perspective on Drawdowns
Here’s a snapshot of selloffs since the 2009 trough.

Here is a more conventional log-scale chart with drawdowns highlighted.
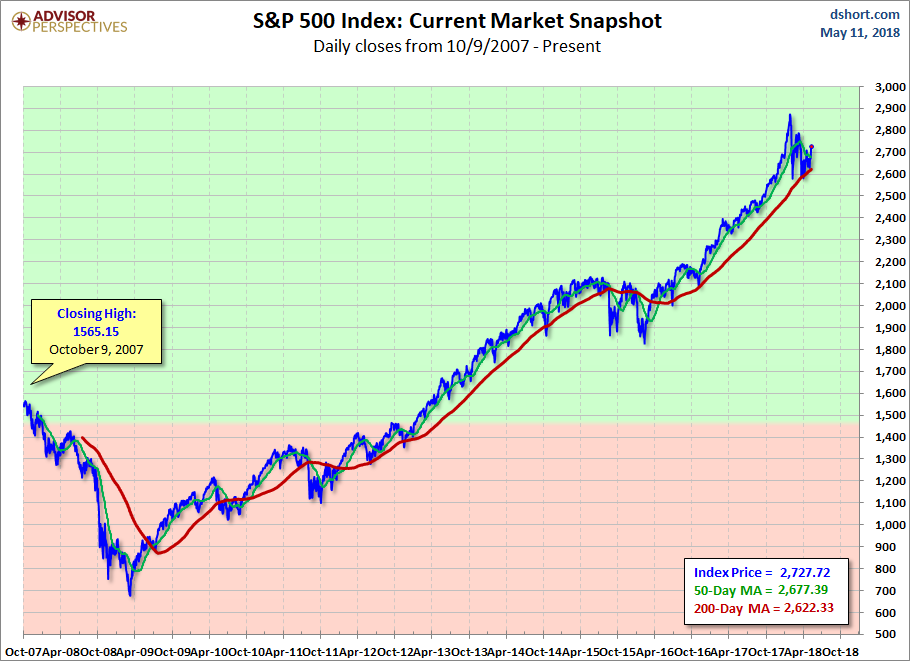
Here is a linear scale version of the same chart with the 50- and 200-day moving averages.
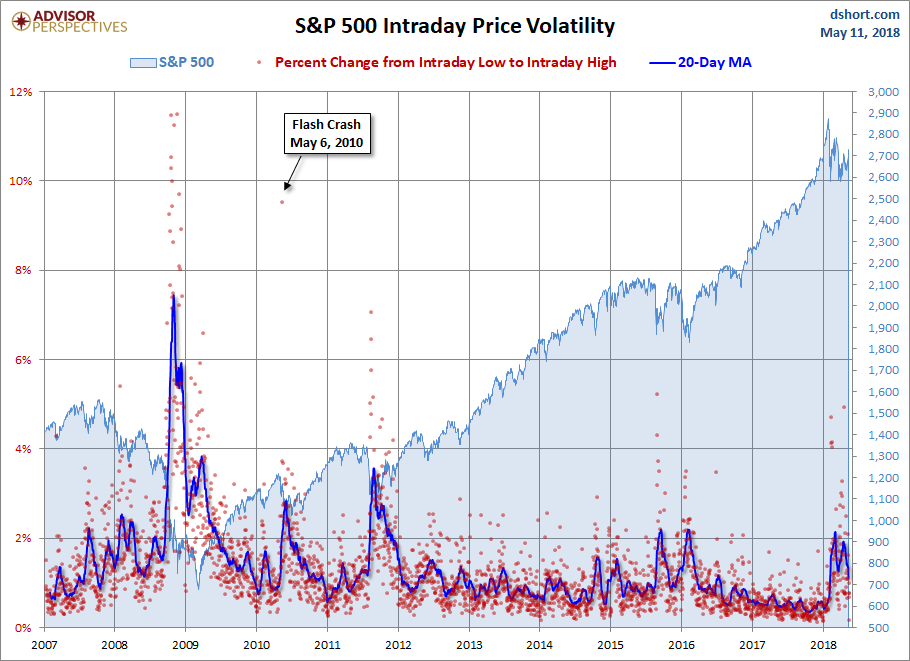
A Perspective on Volatility
For a sense of the correlation between the closing price and intraday volatility, the chart below overlays the S&P 500 since 2007 with the intraday price range. We’ve also included a 20-day moving average to help identify trends in volatility.


Leave A Comment