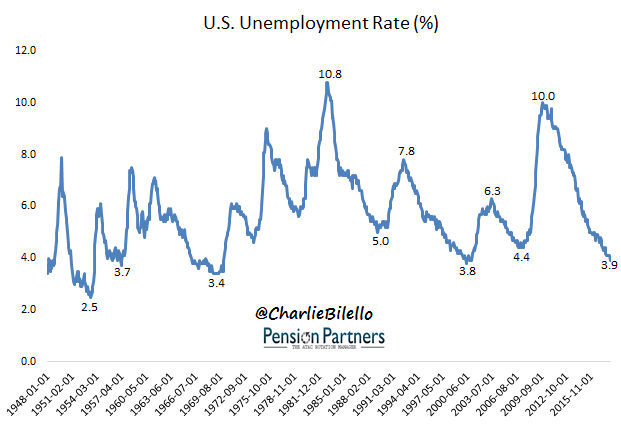
The U.S. Unemployment Rate has moved down to 3.9%, its lowest level since December 2000. If you ask the average person on the street what that means for the stock market, they would likely say it’s a bullish sign. What does it actually mean? Let’s take a look…

Data Source for all charts/tables herein: FRED, Bloomberg, Robert Shiller
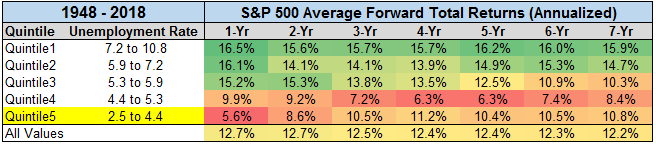
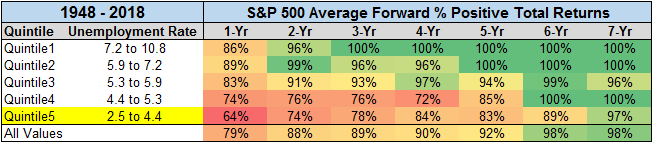
We have data on the Unemployment Rate going back to 1948. Breaking the data up into quintiles, we observe the following:
What’s driving this counterintuitive relationship? Valuation. On average, lower unemployment rates tend to be associated with higher valuations and vice versa.
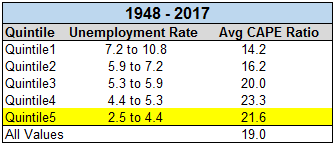
Why? Because when there’s good news in the economy (low unemployment), people are willing to pay a higher multiple for a given level of earnings than when there’s bad news (high unemployment). That’s important when it comes to stocks because higher valuations tend to be associated with below average forward returns.
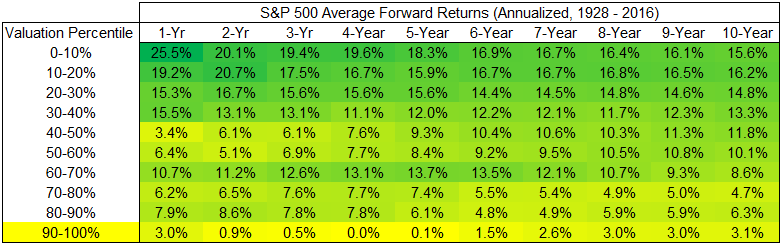
Note: Above table uses CAPE Ratio.
In January, the S&P 500’s valuation hit the 97th percentile, higher than every period in history with the exception of the late 1990s and early 2000s.


Leave A Comment